---
title: "Posterior predictive power spectra"
format:
html:
code-fold: true
code-tools: true
code-line-numbers: true
page-layout: full
grid:
sidebar-width: 50px
body-width: 1200px
margin-width: 200px
pdf: default
jupyter: python3
---
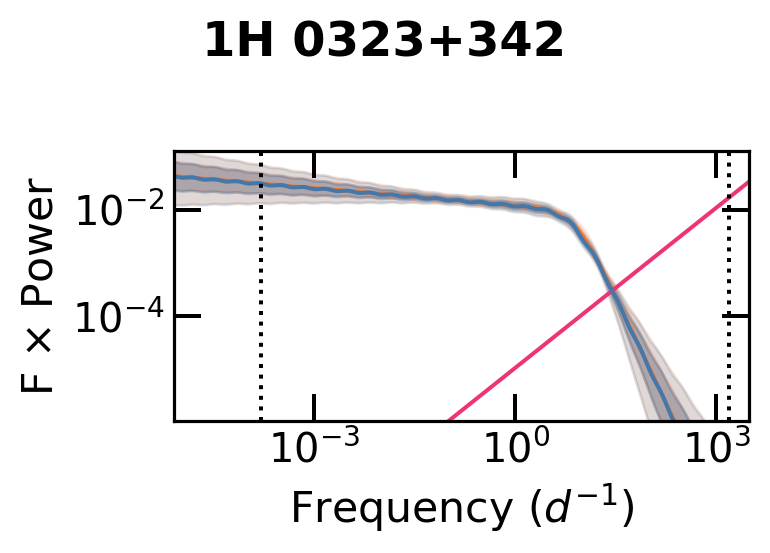
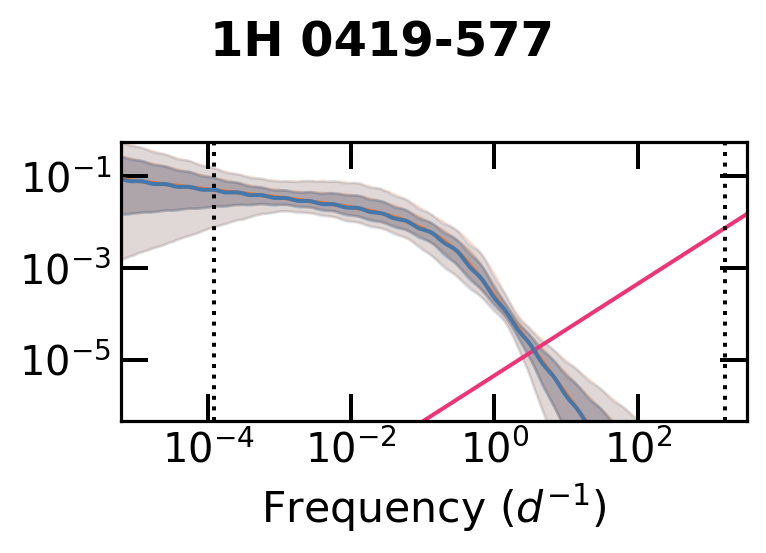
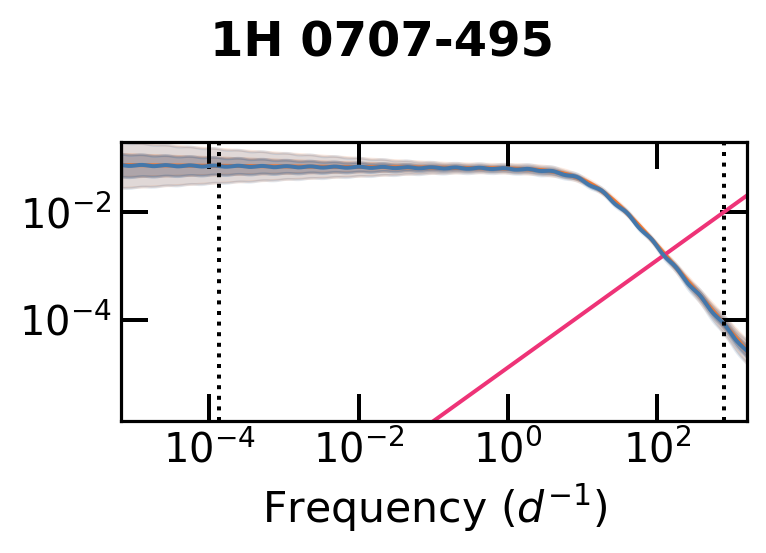
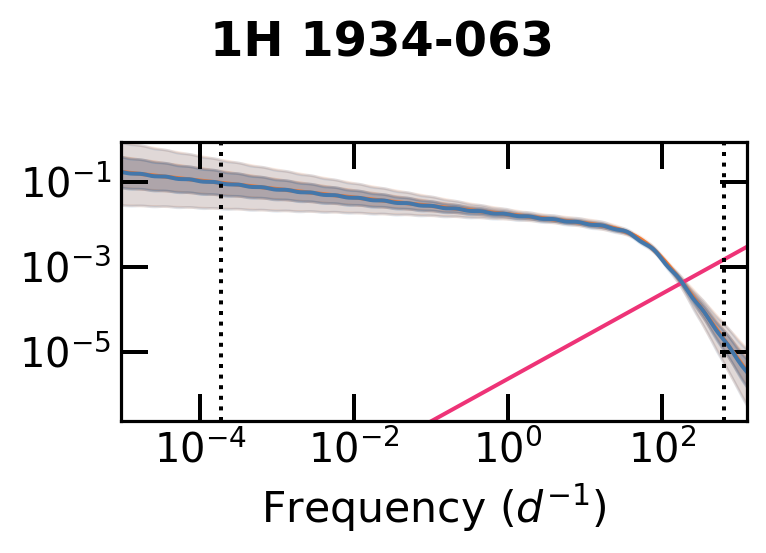
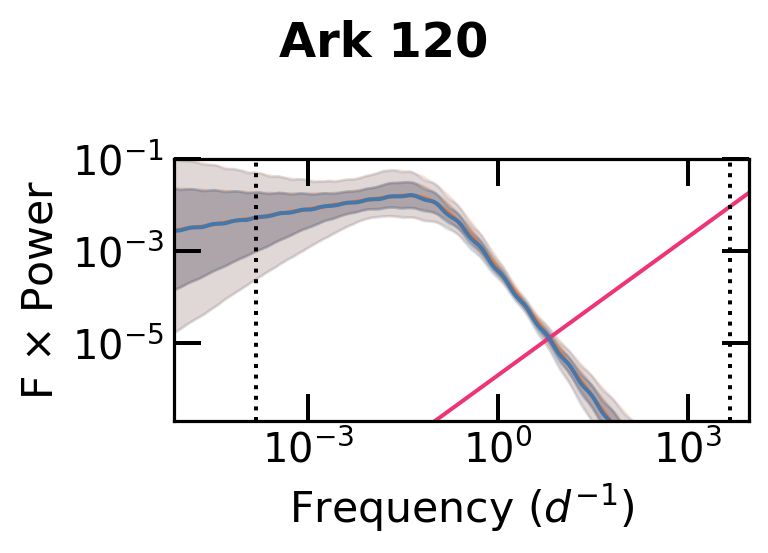
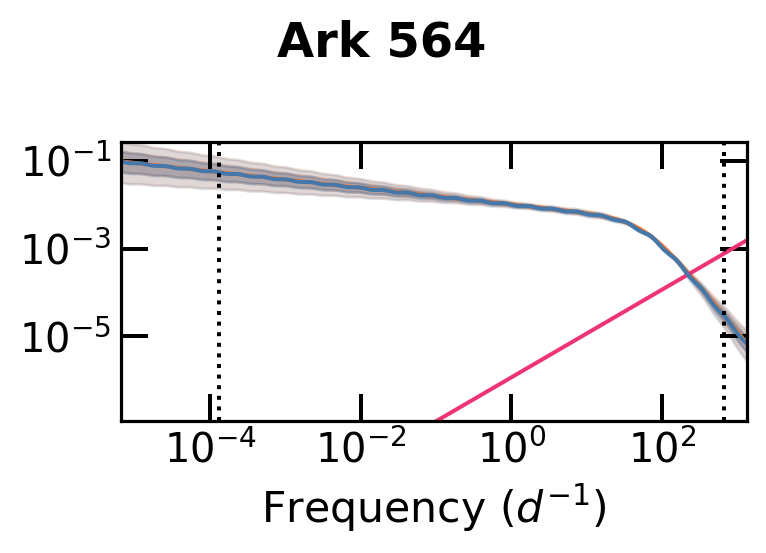
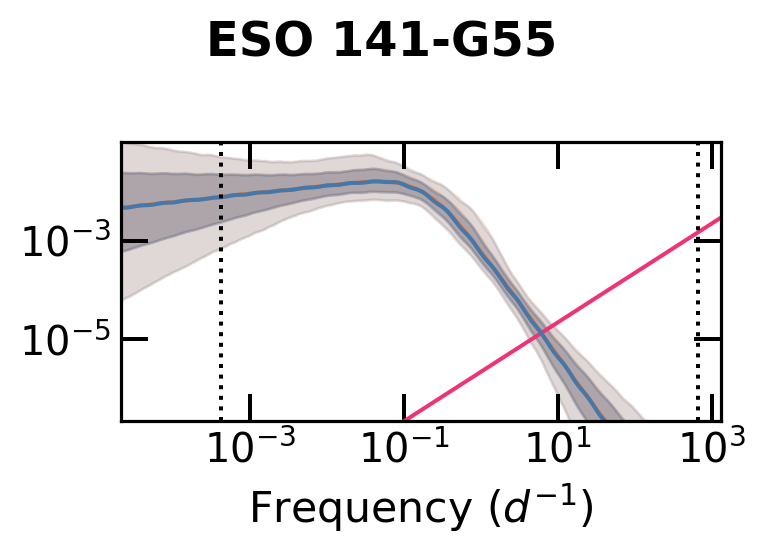
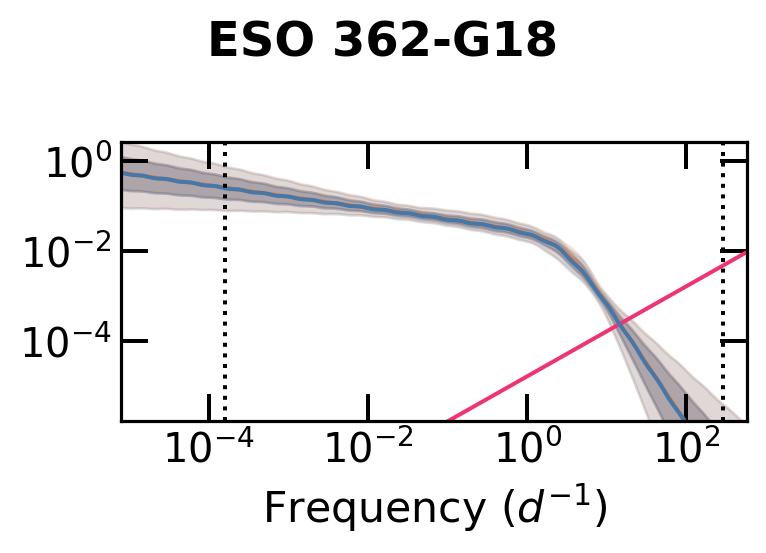
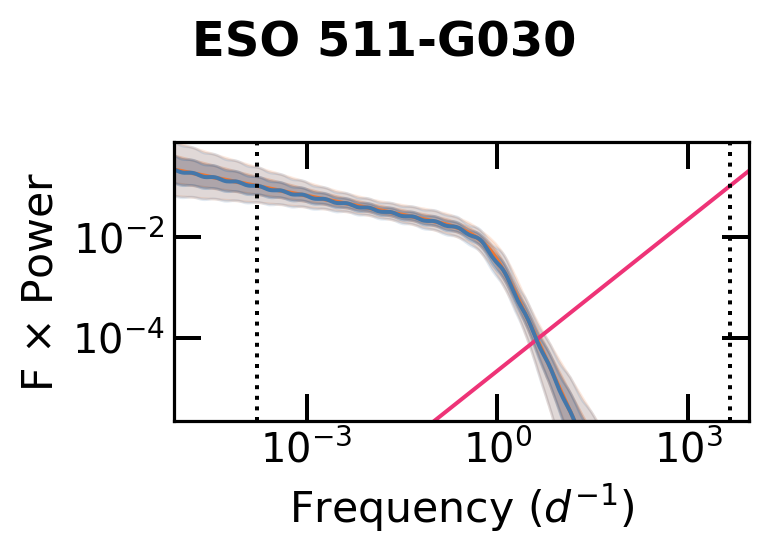
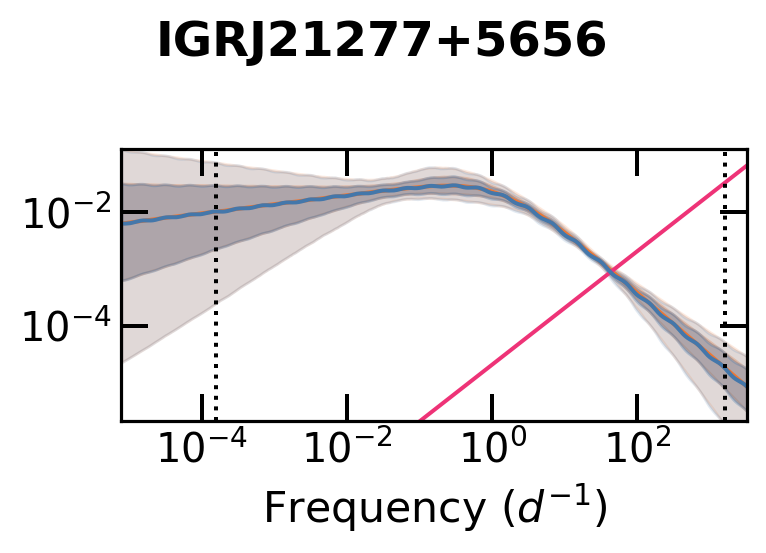
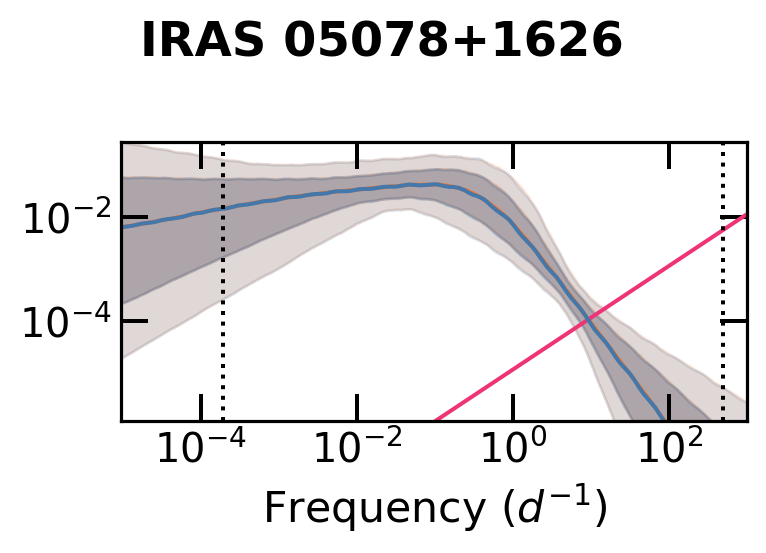
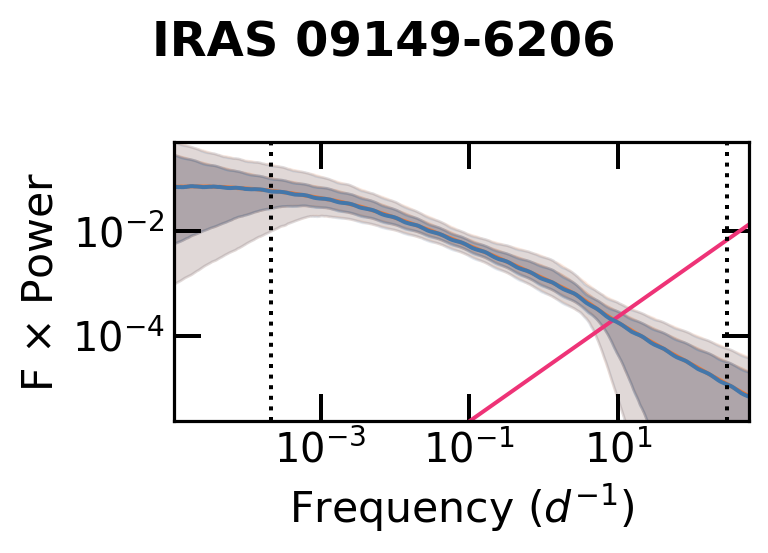
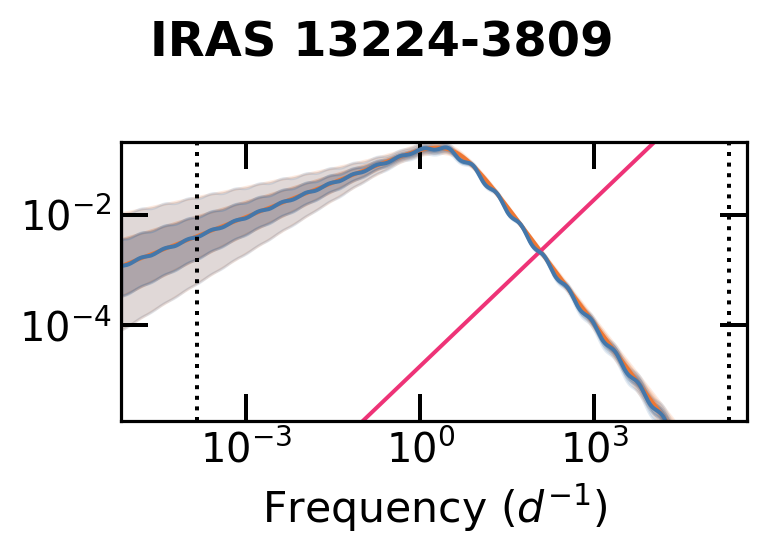
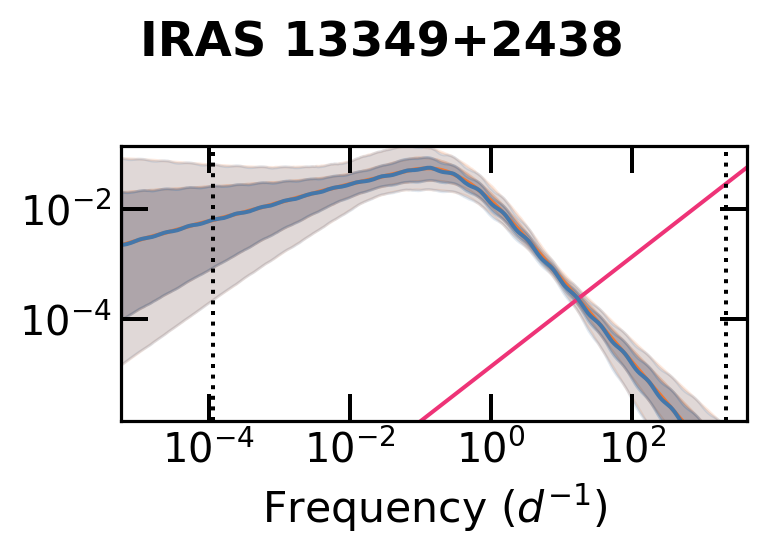
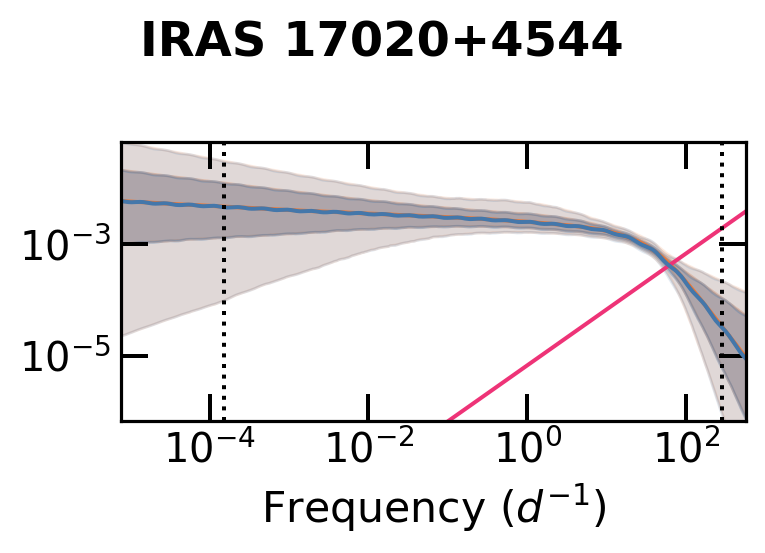
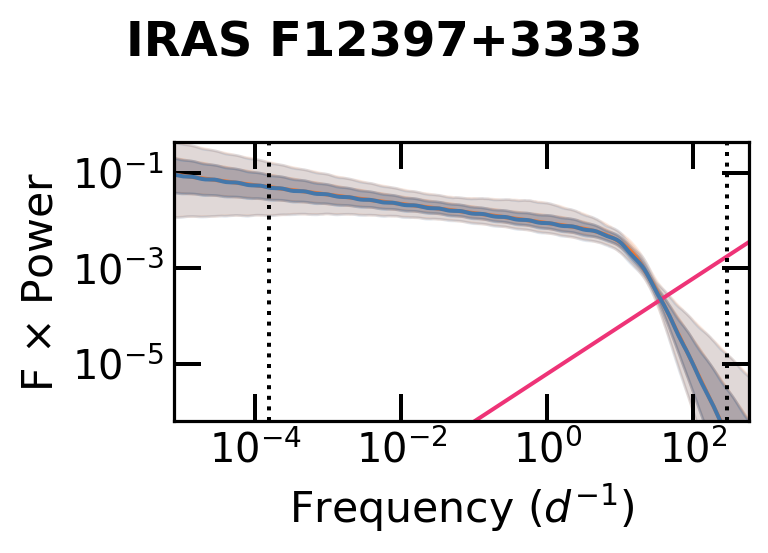
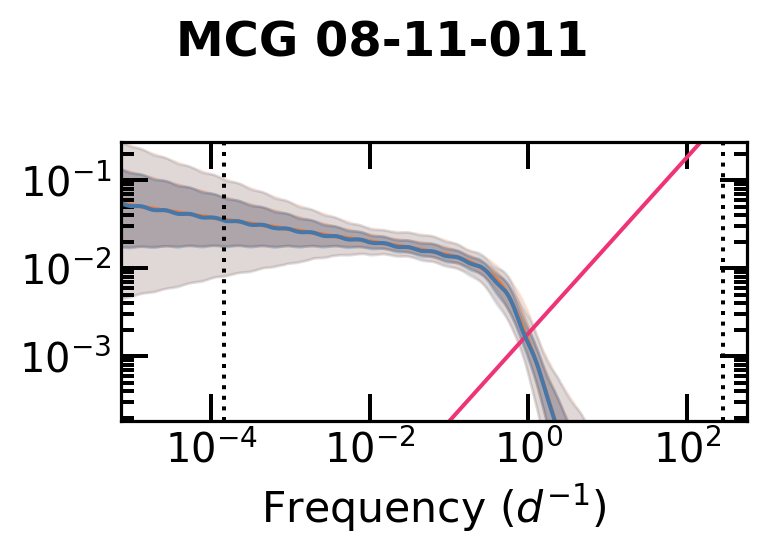
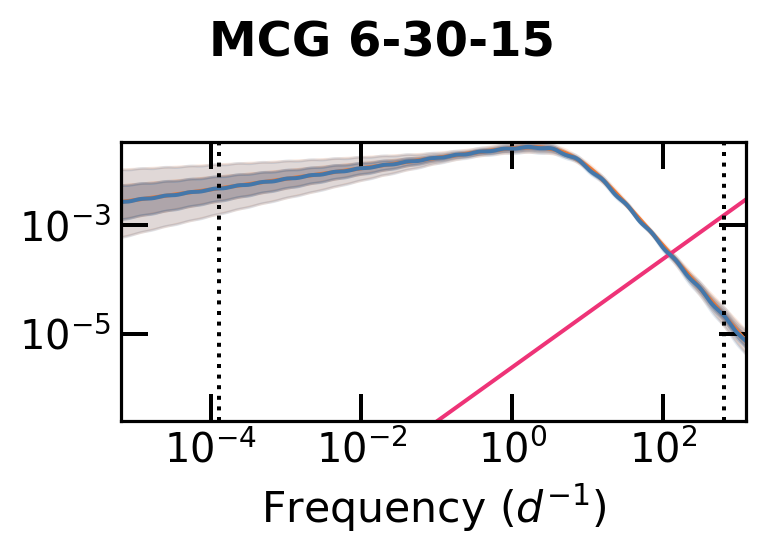
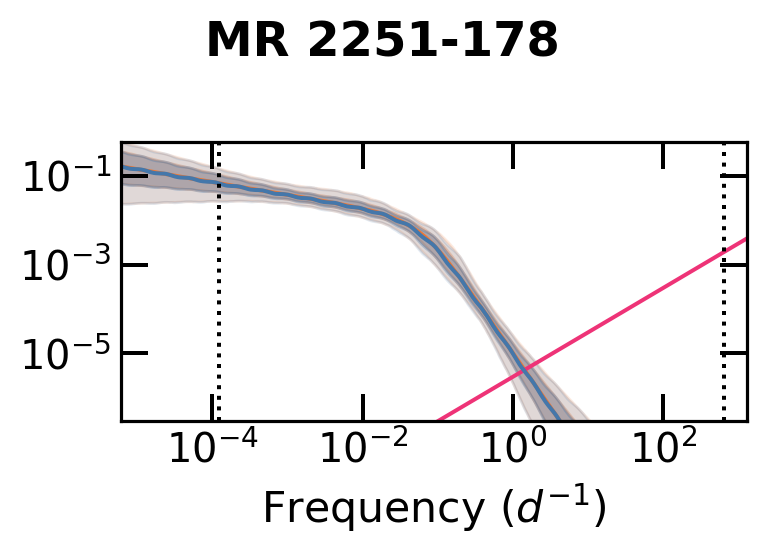
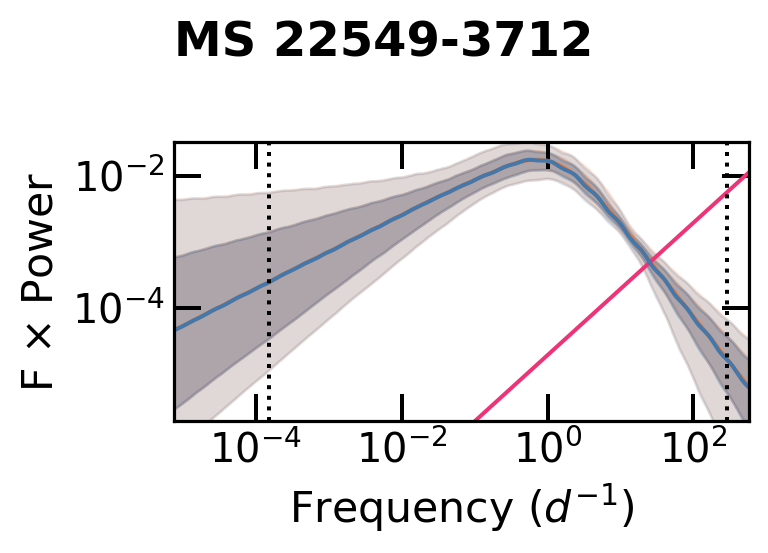
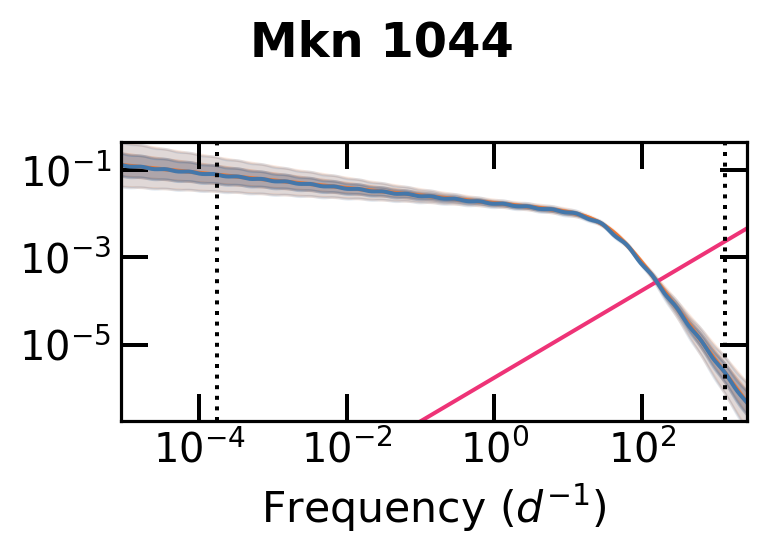
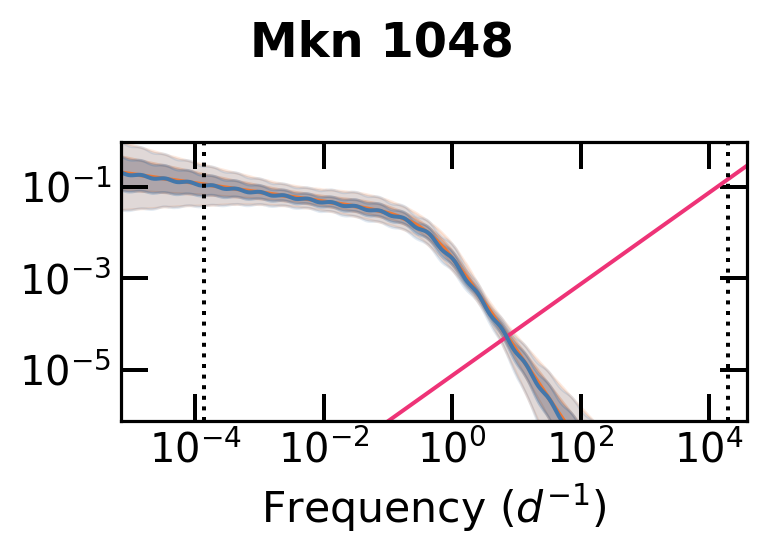
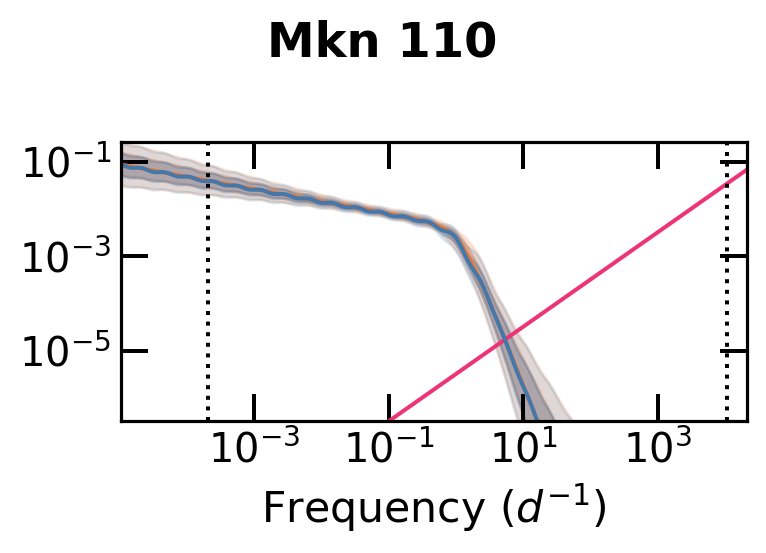
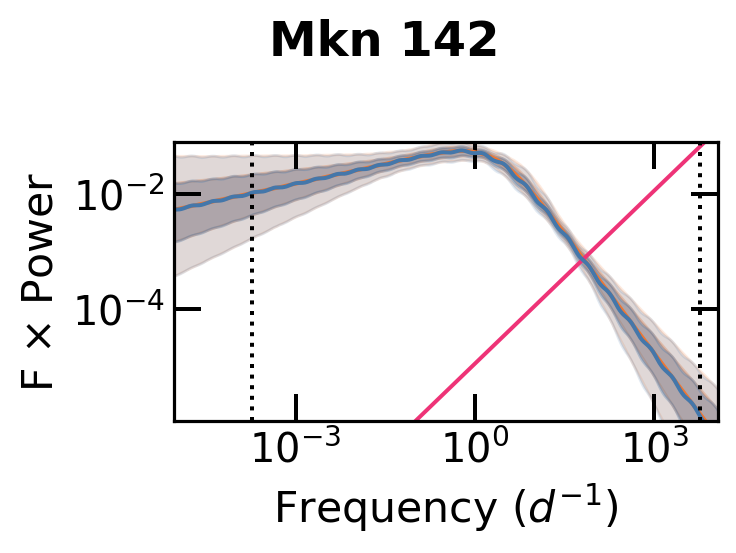
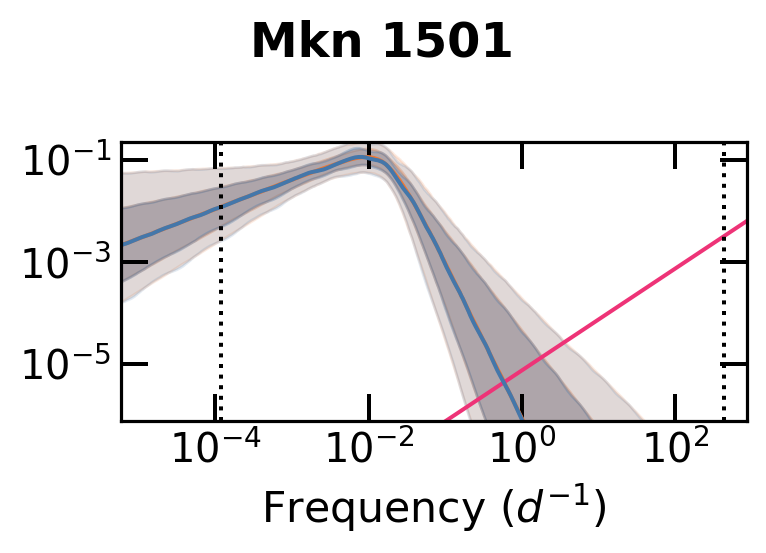
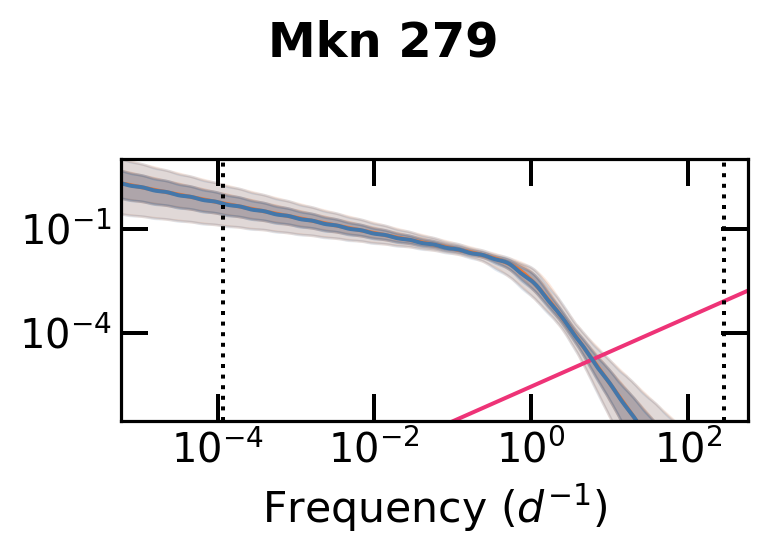
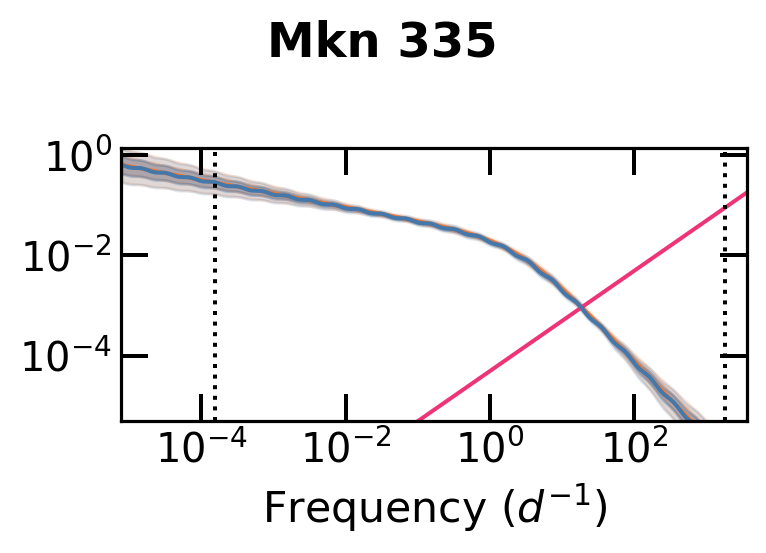
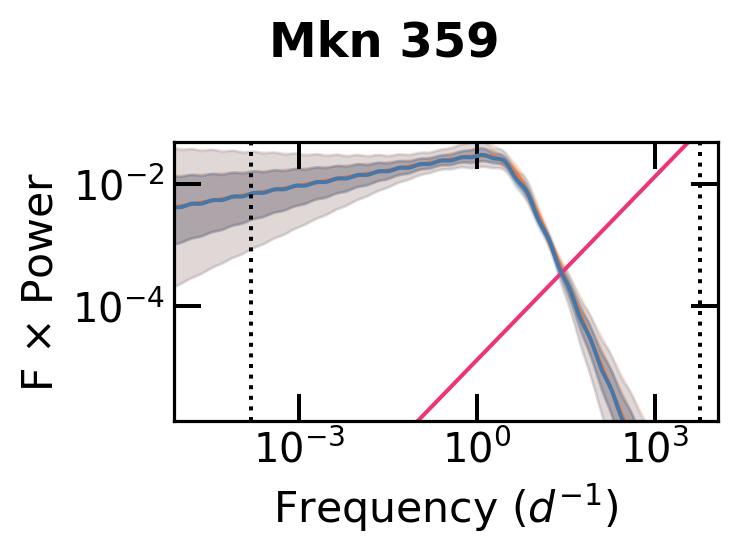
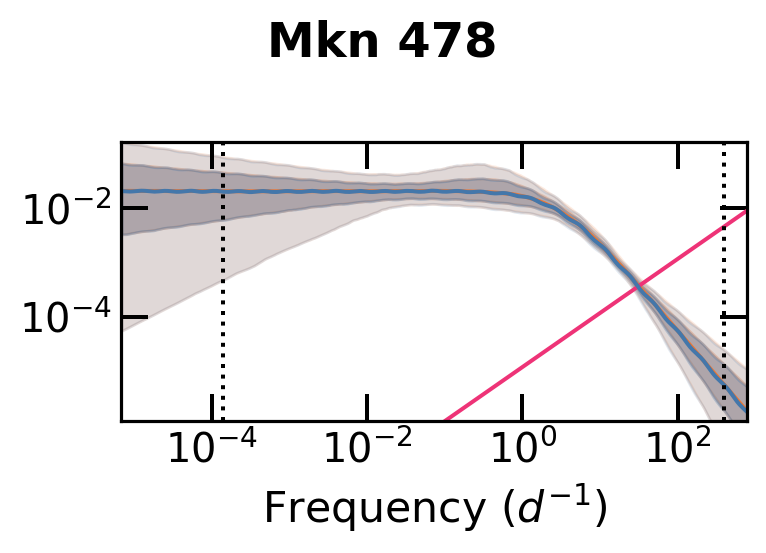
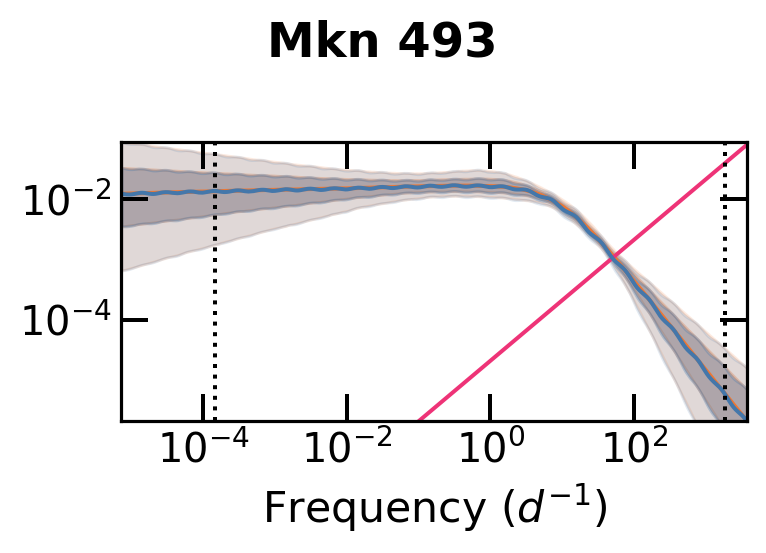
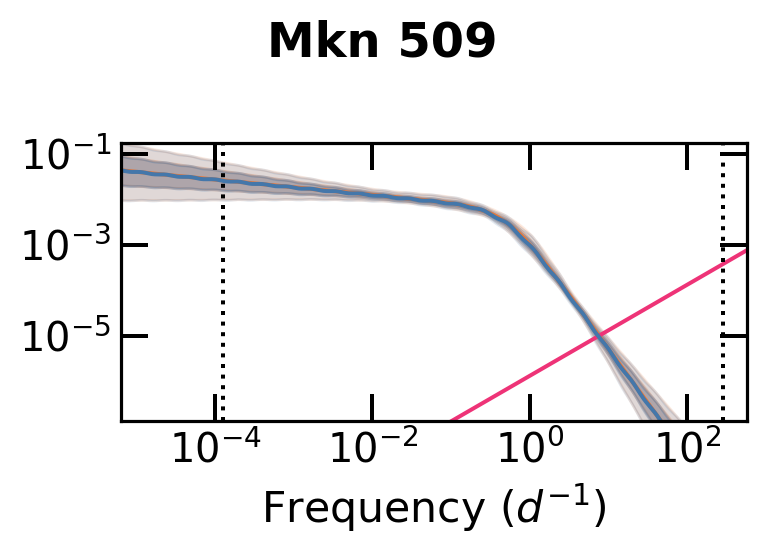
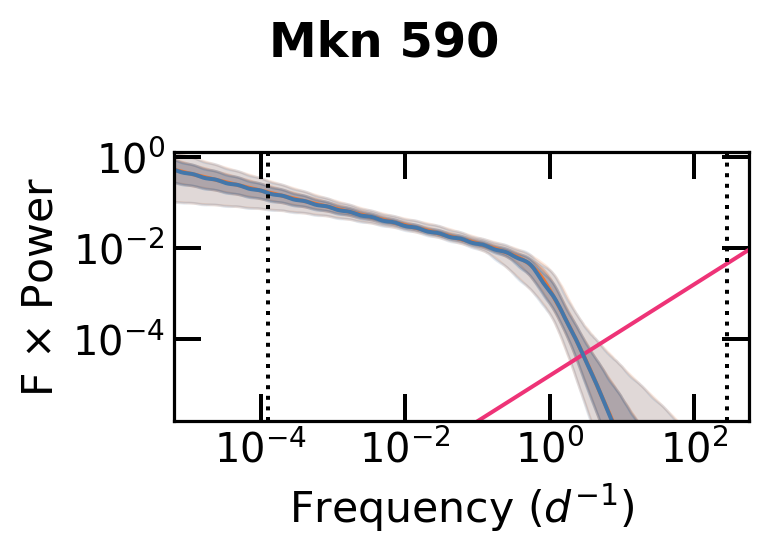
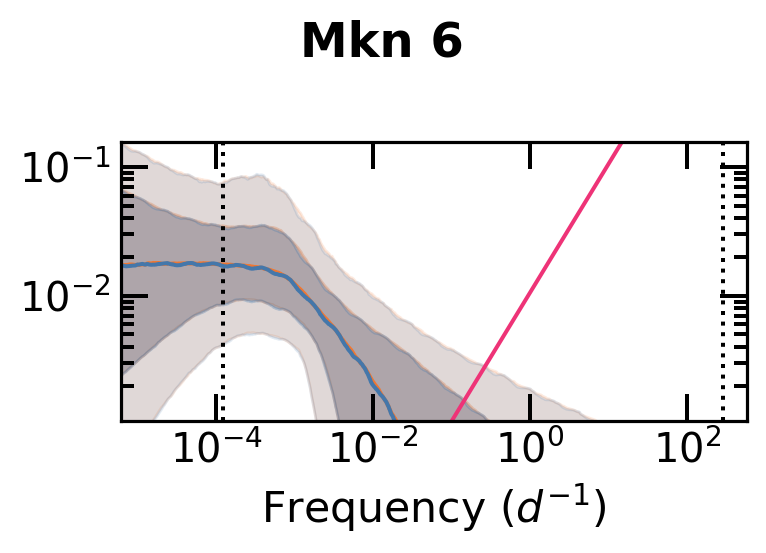
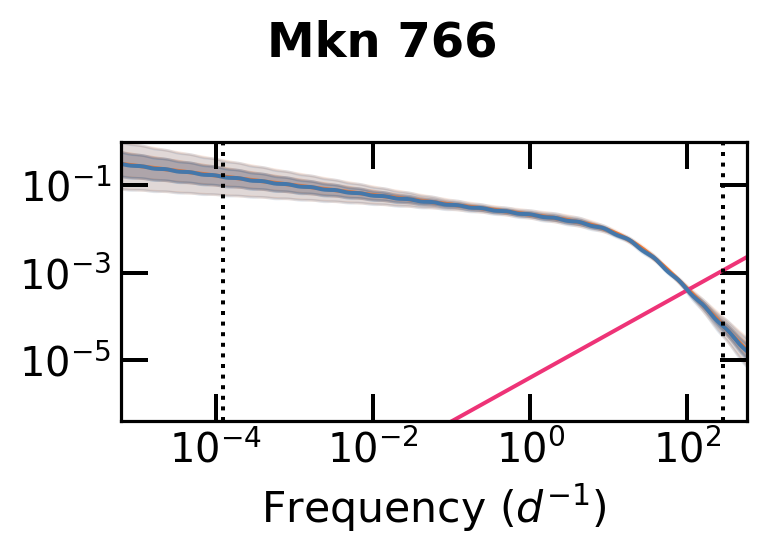
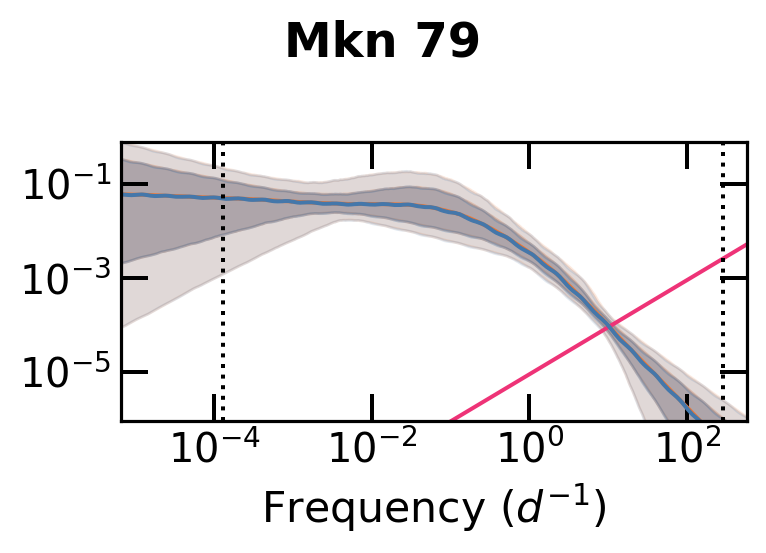
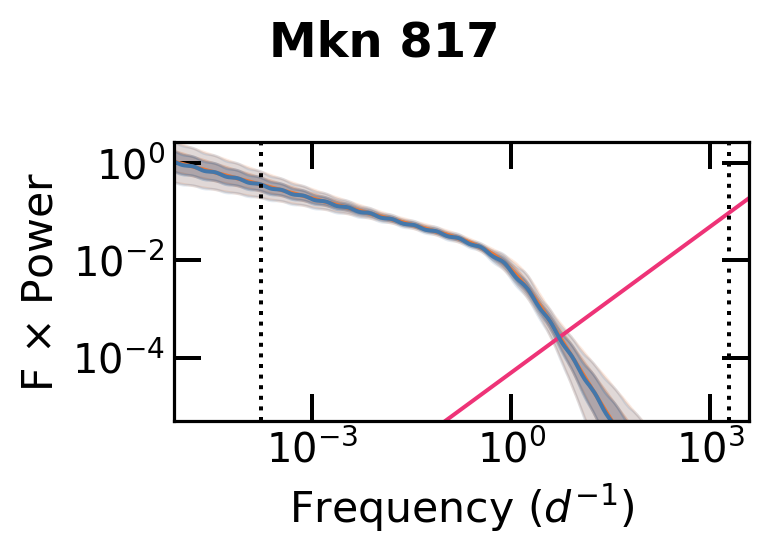
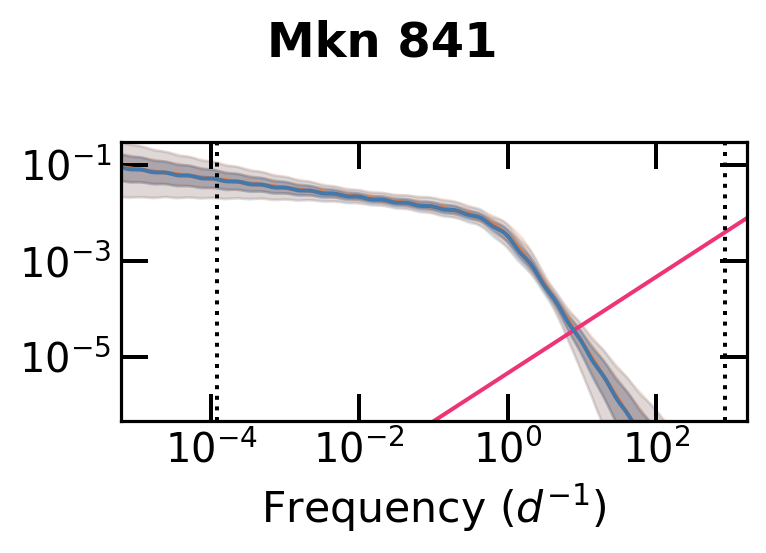
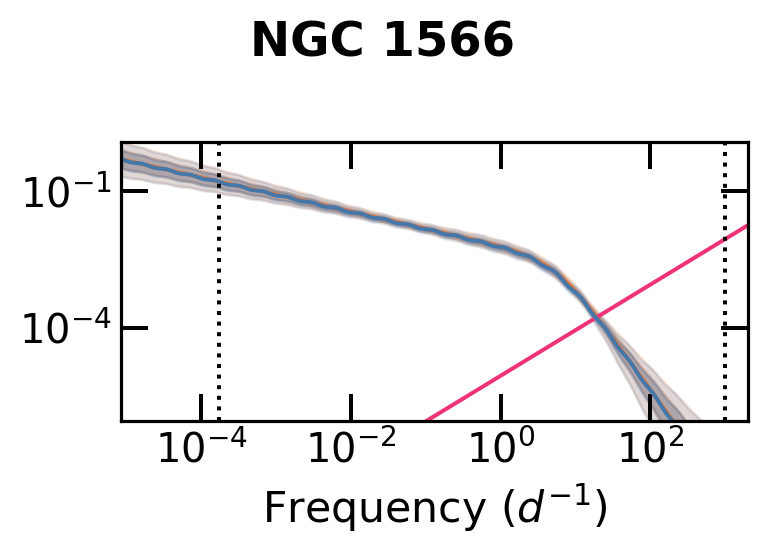
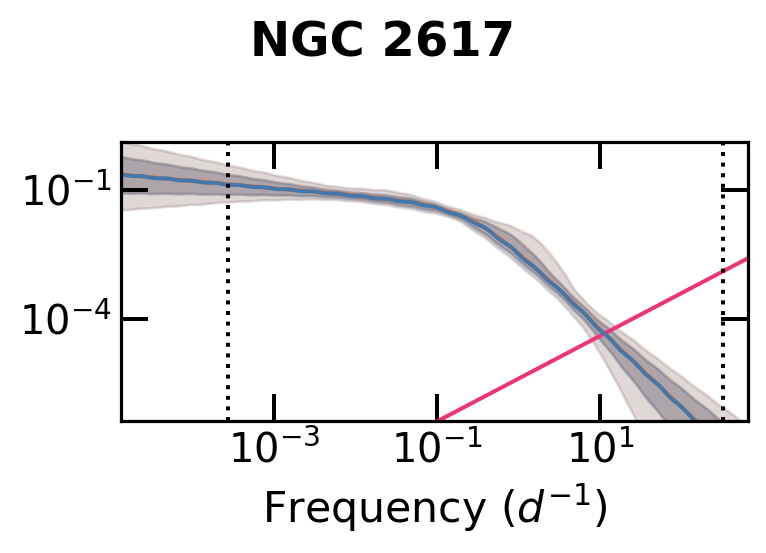
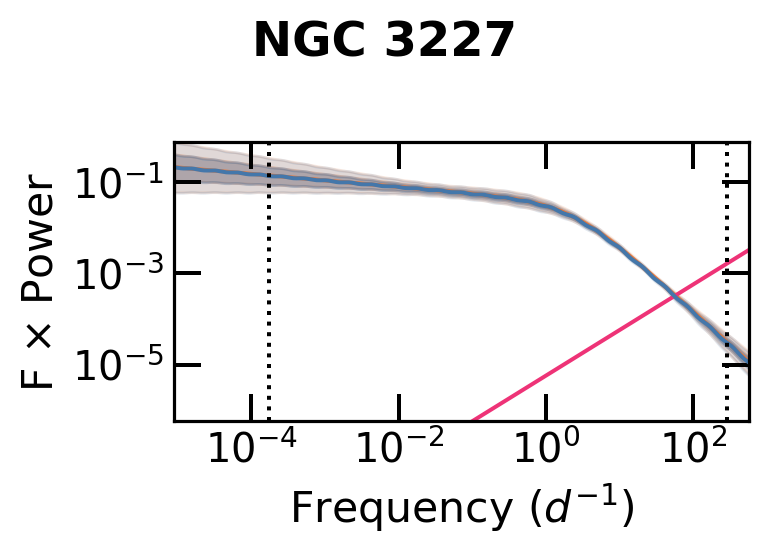
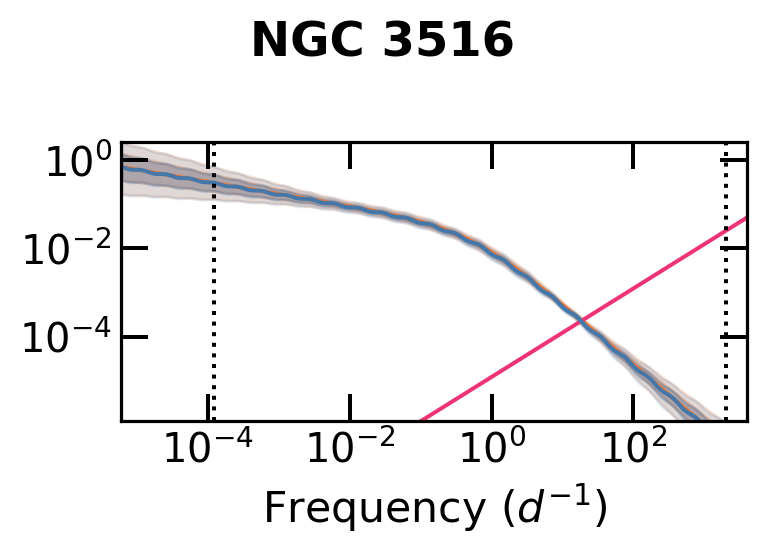
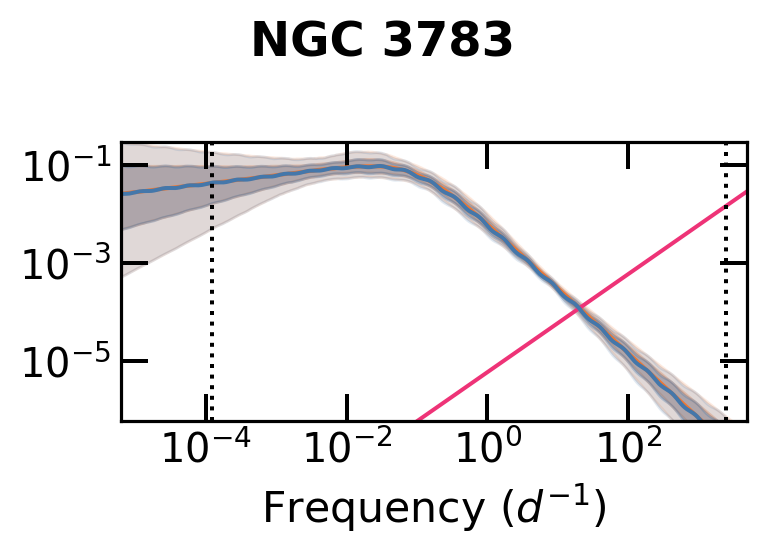
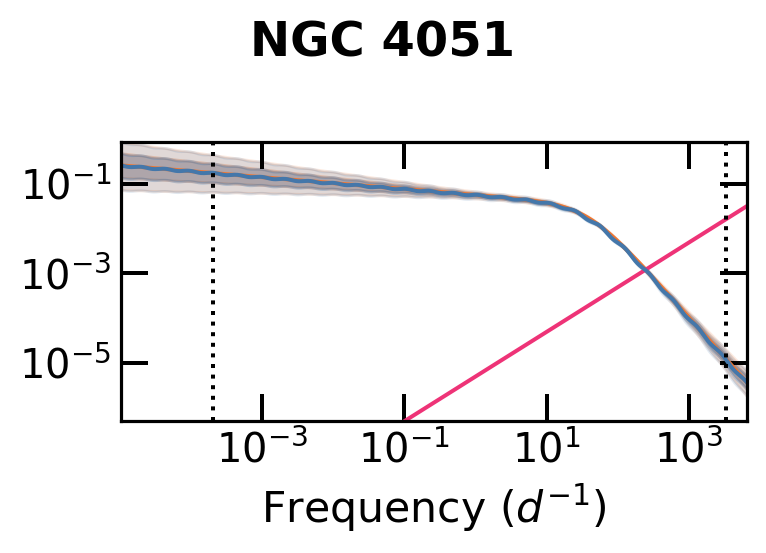
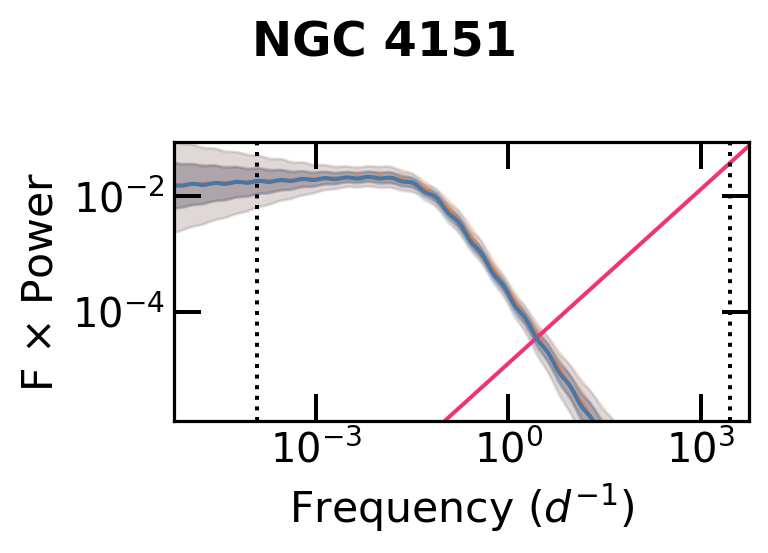
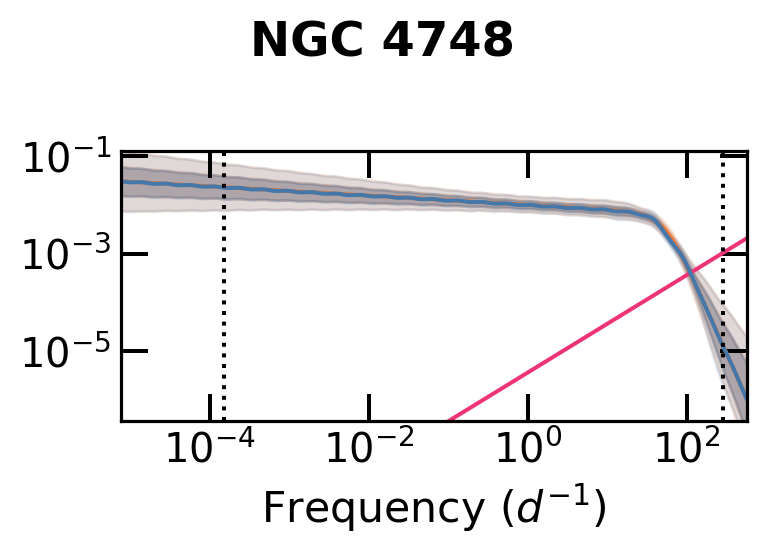
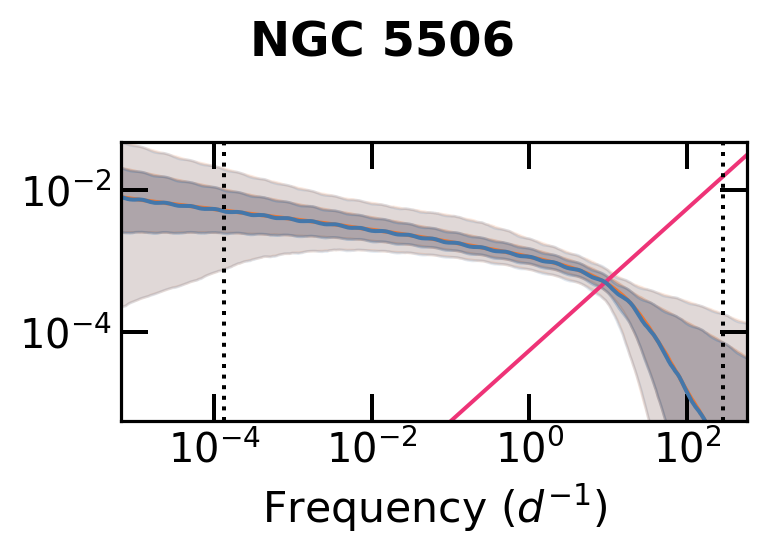
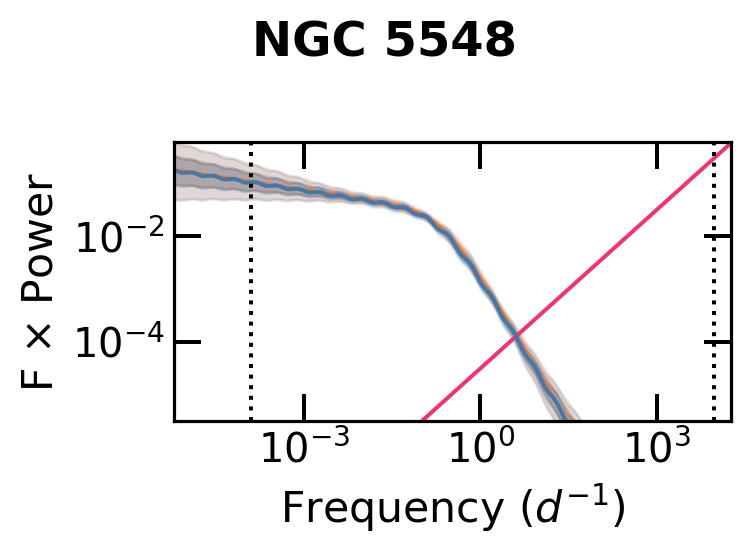
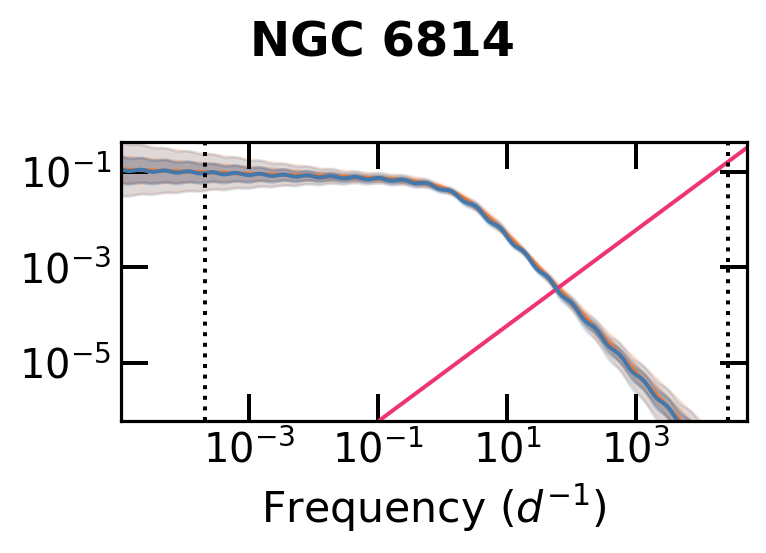
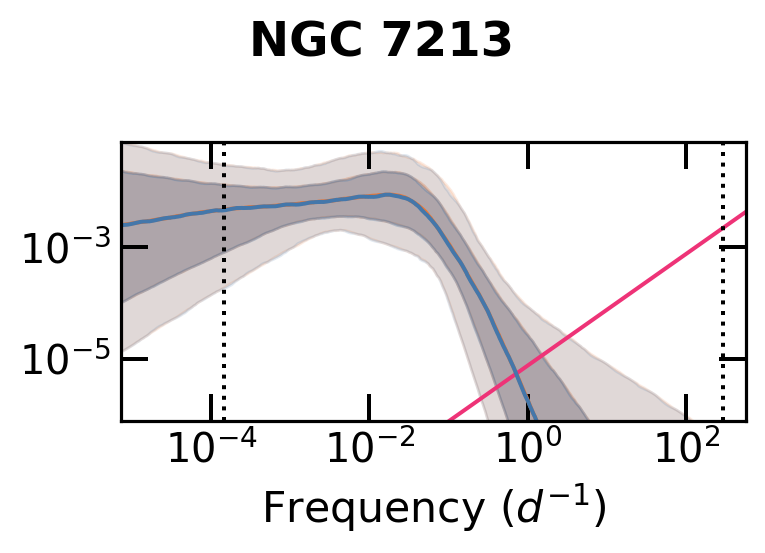
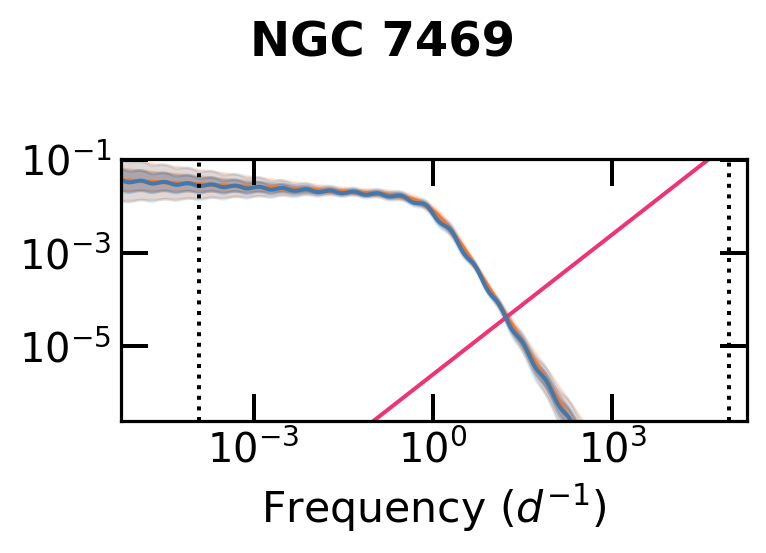
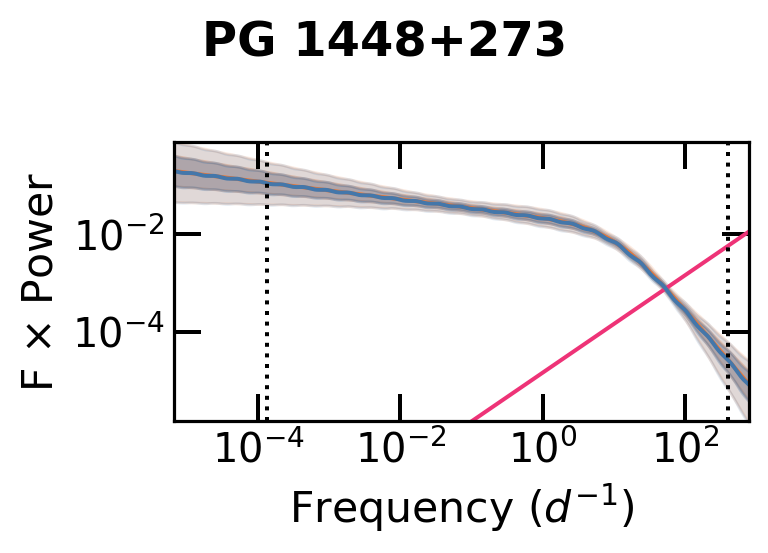
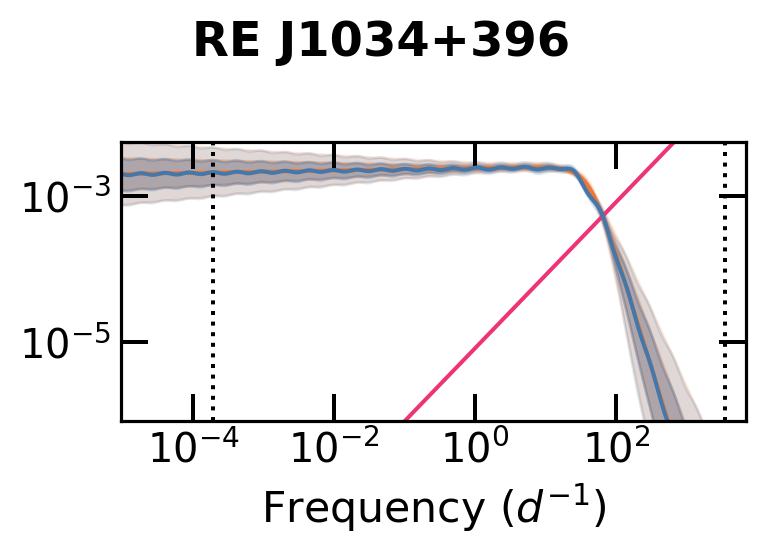
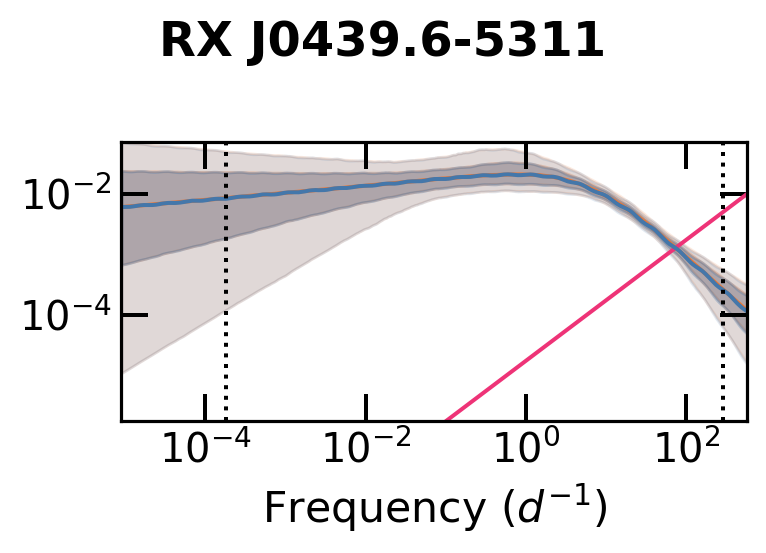
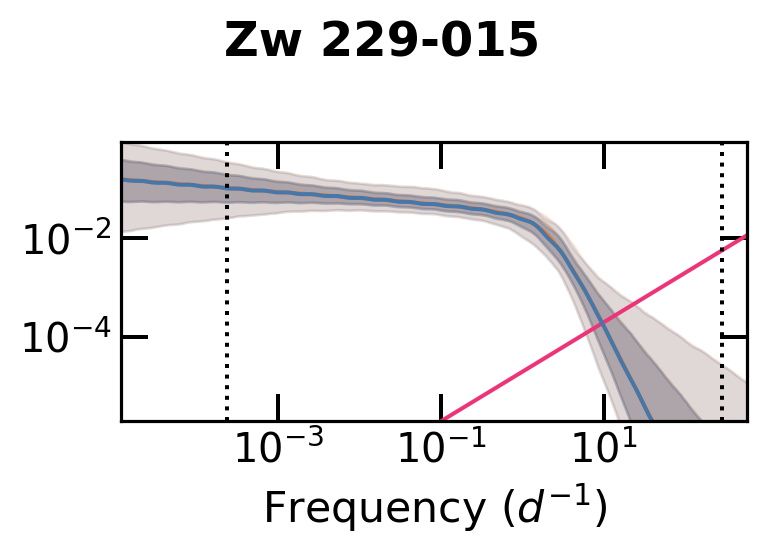
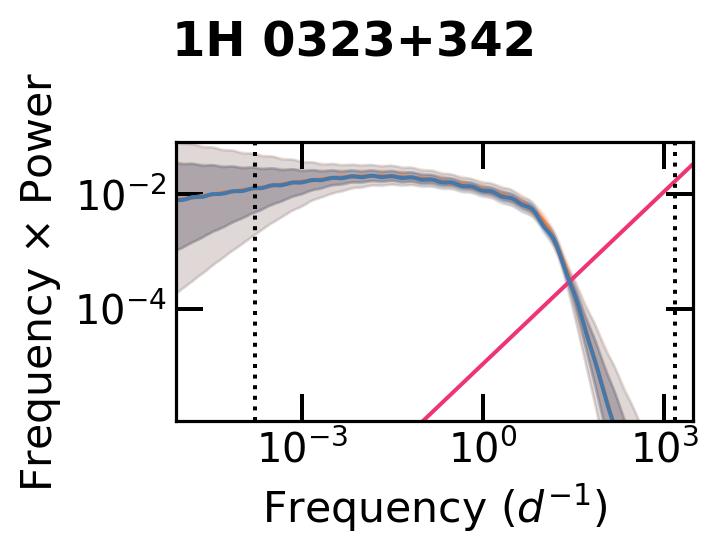
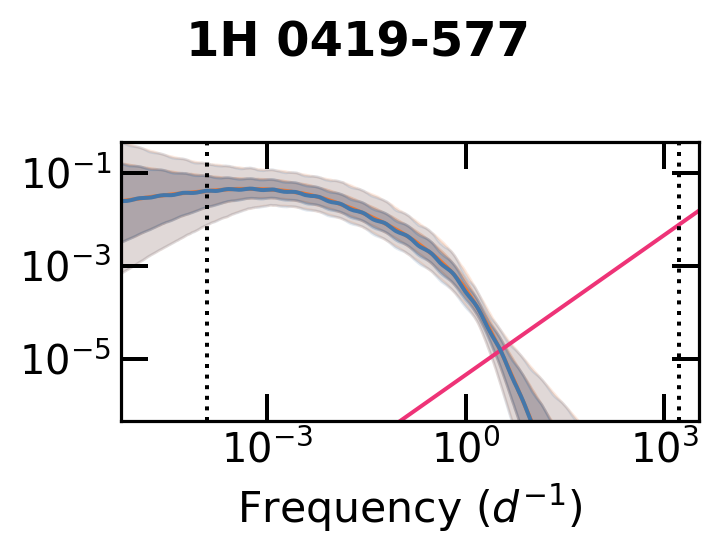
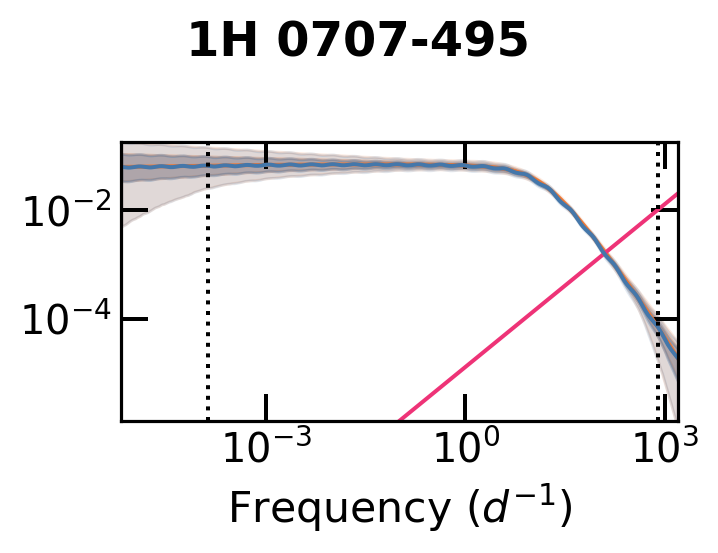
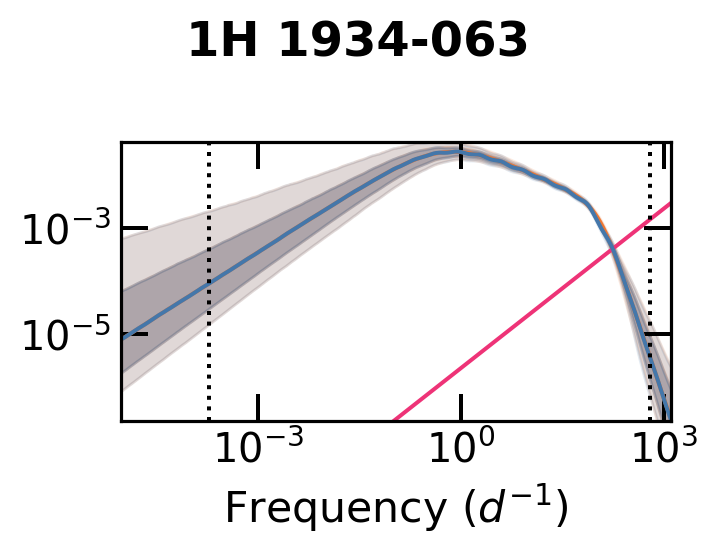
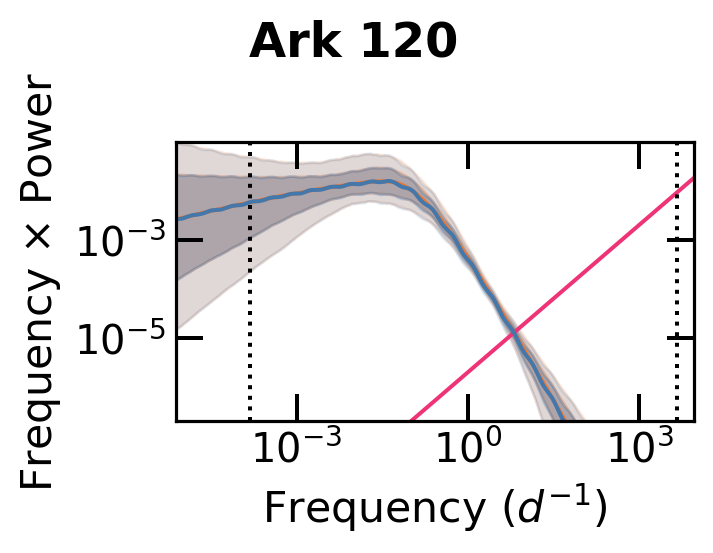
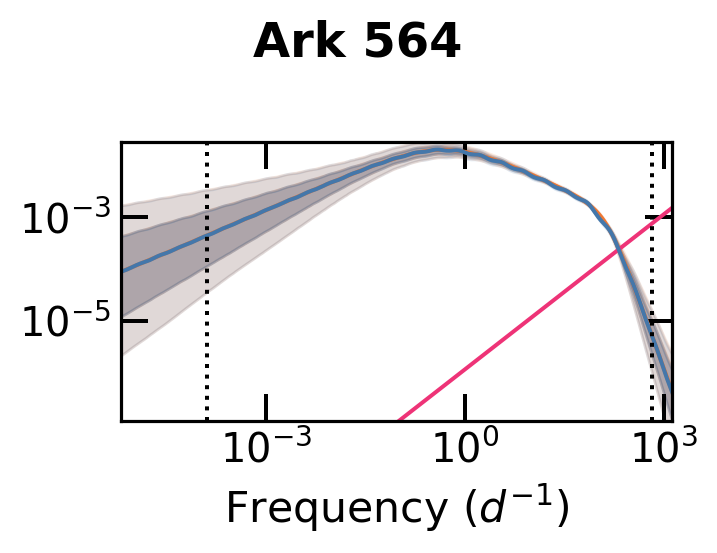
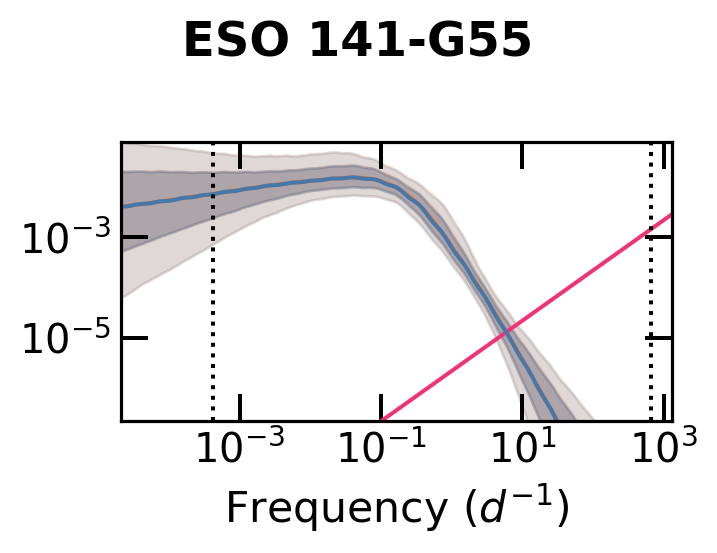
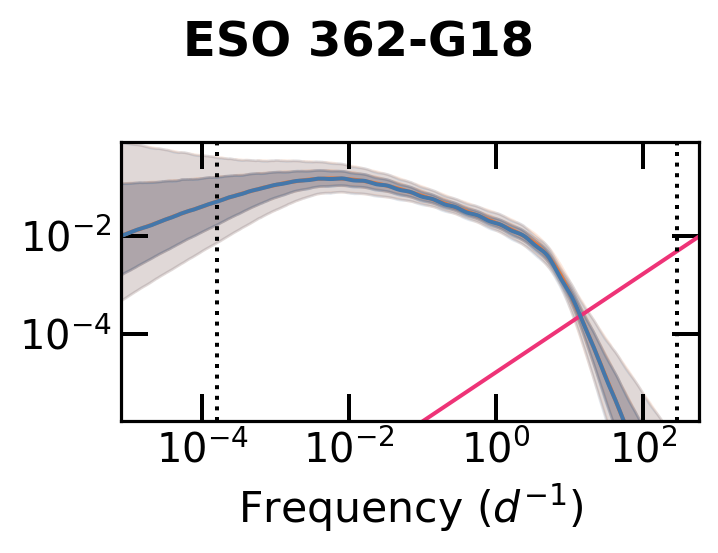
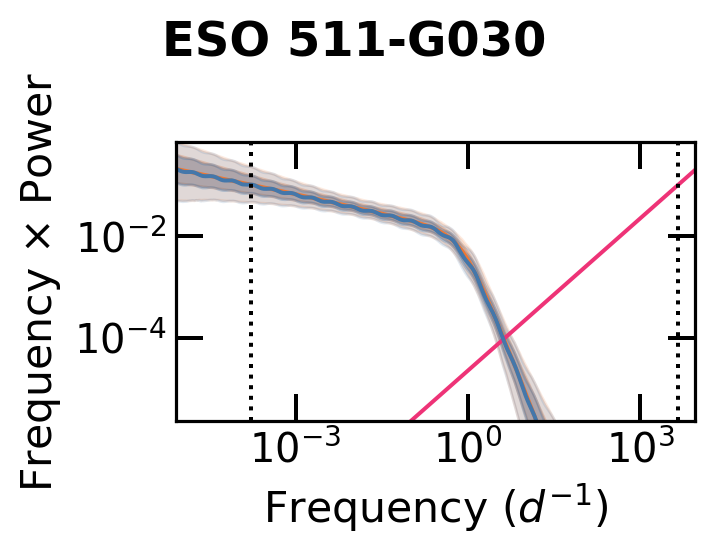
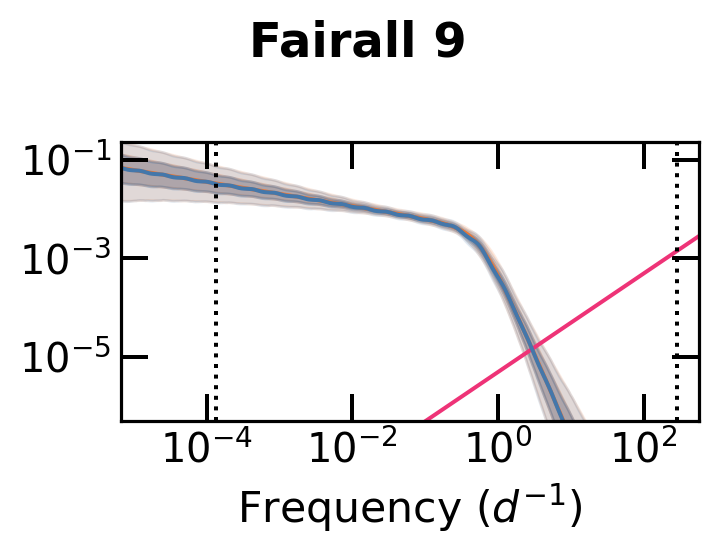
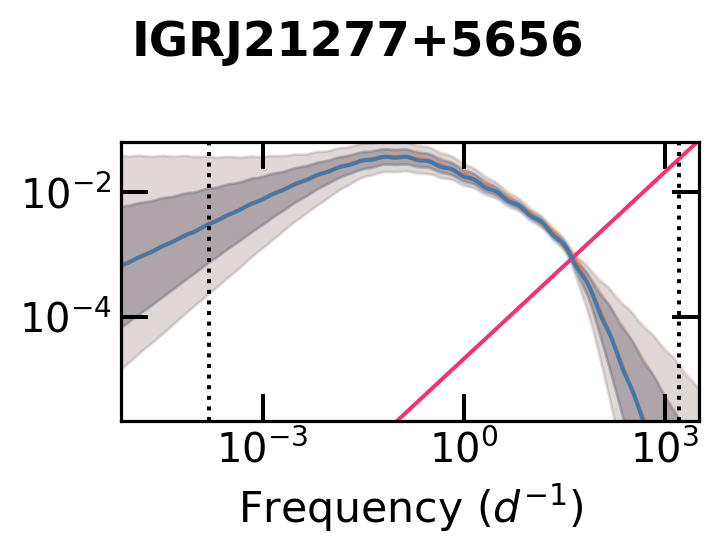
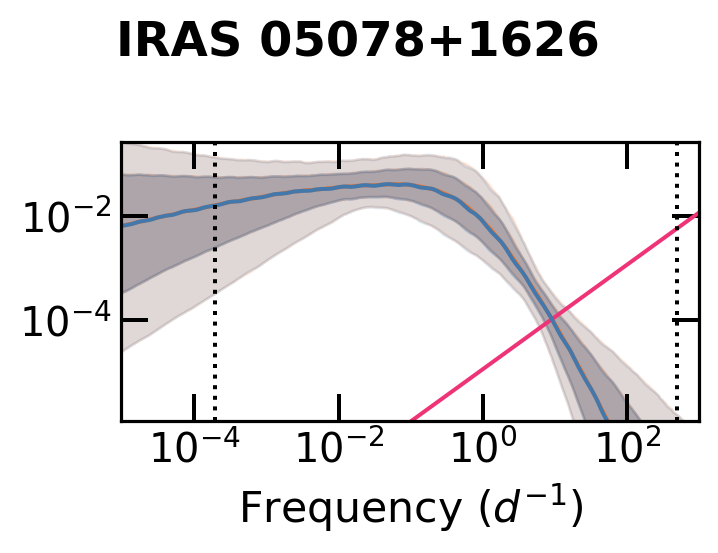
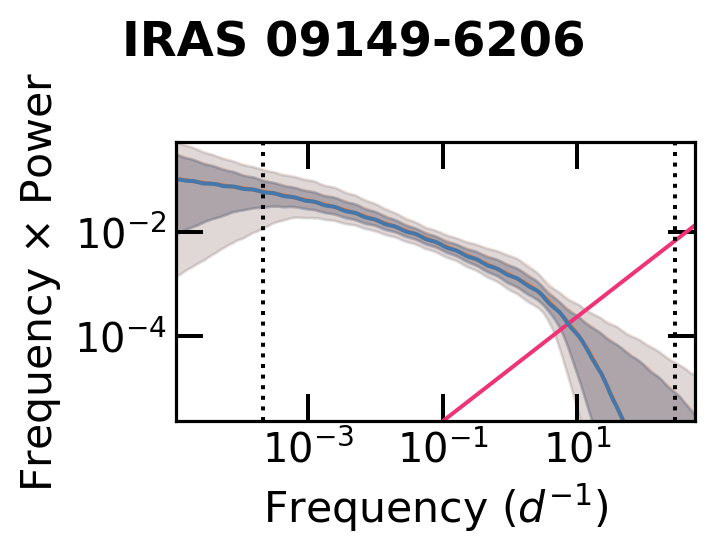
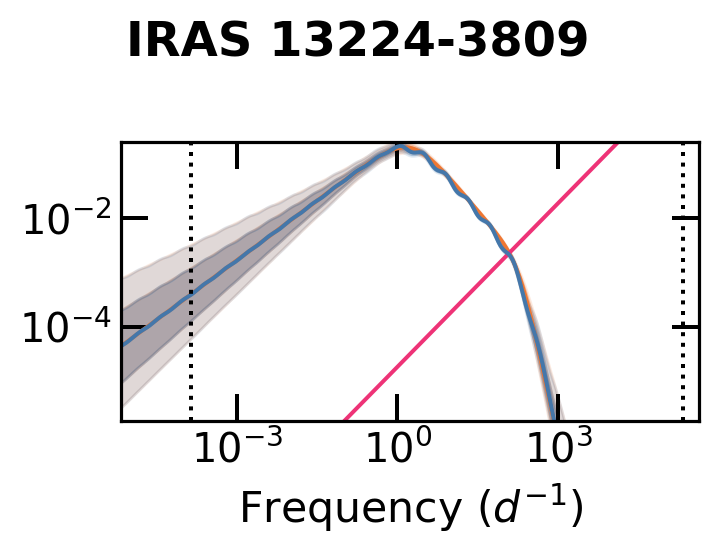
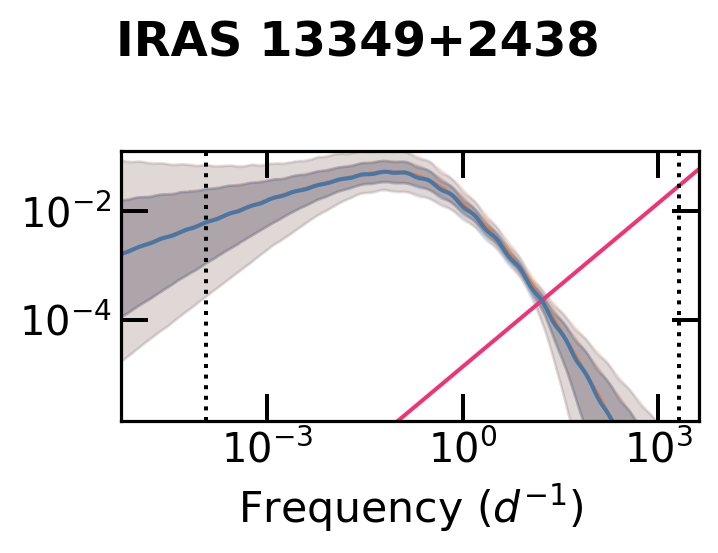
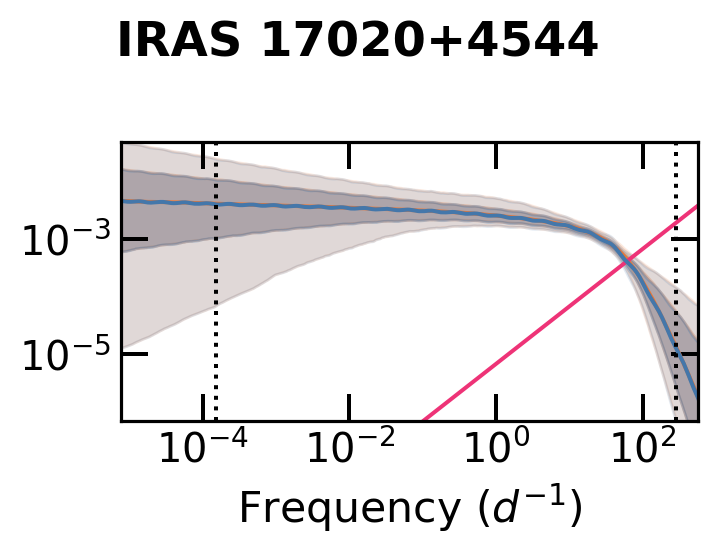
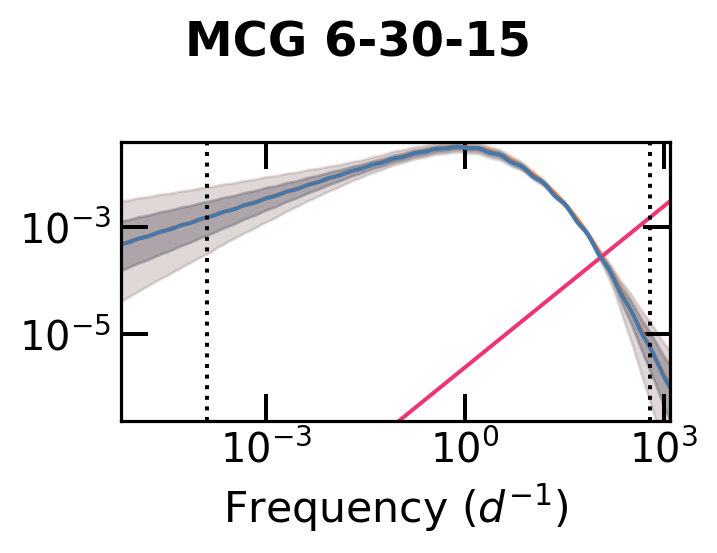
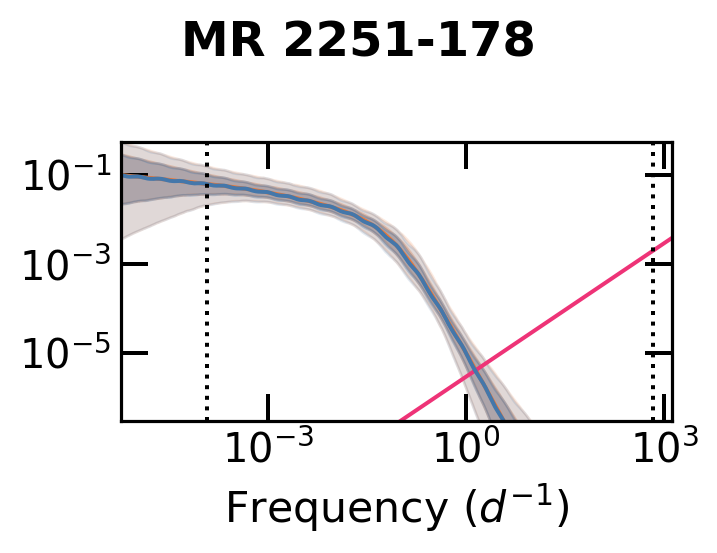
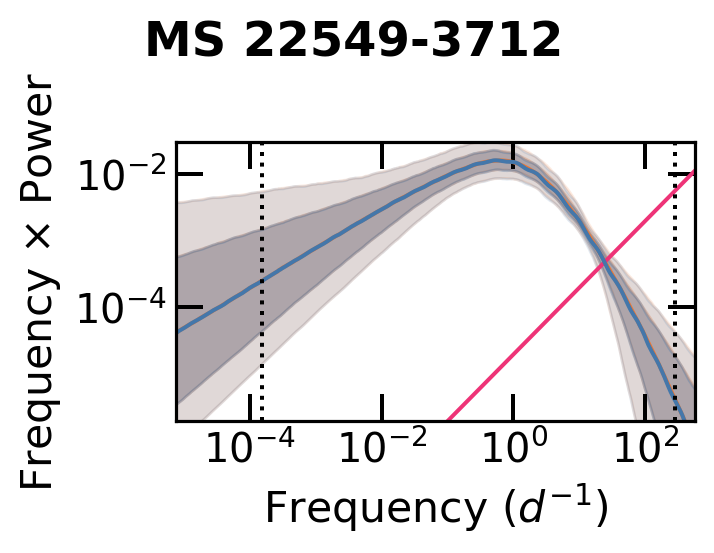
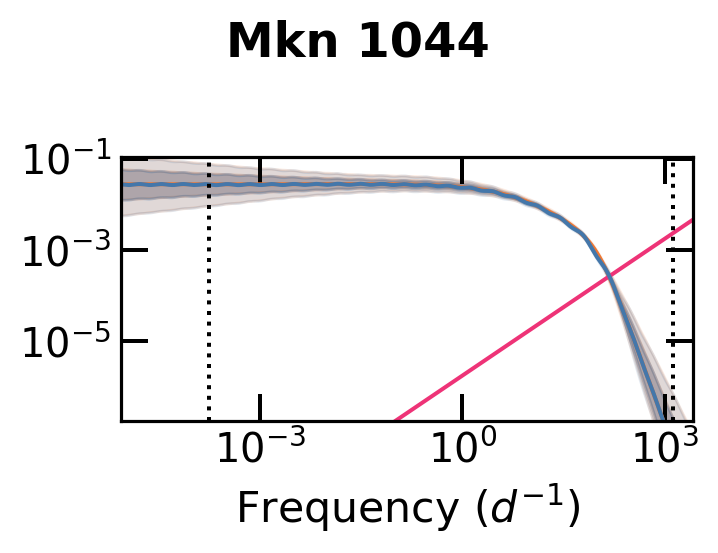
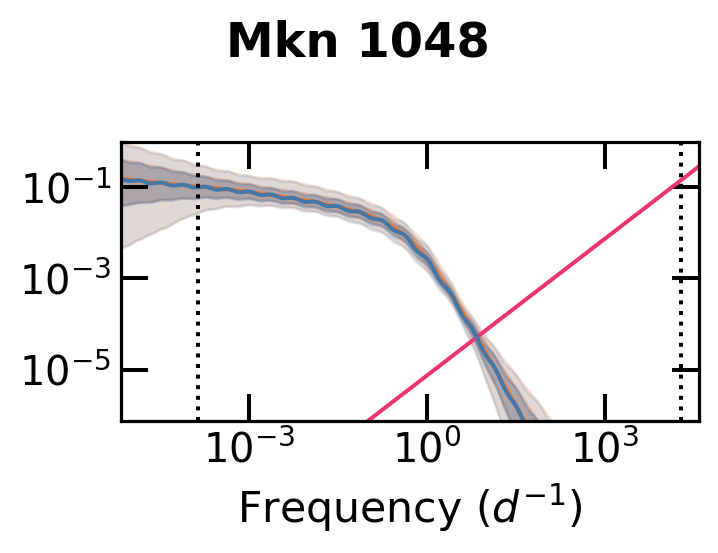
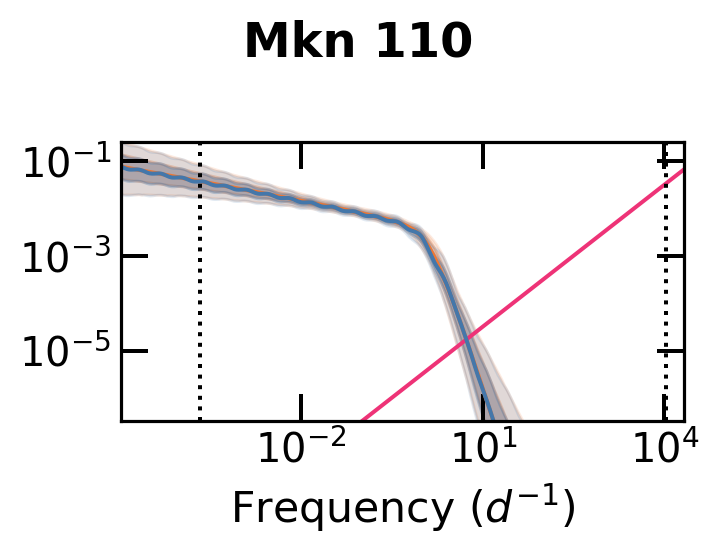
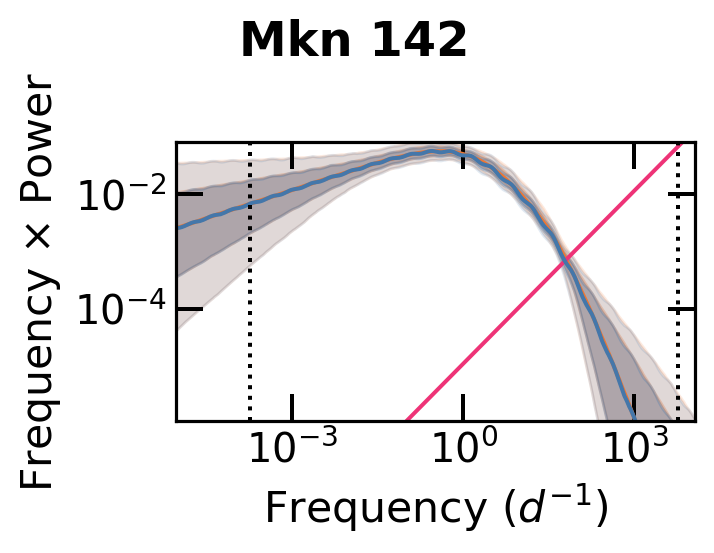
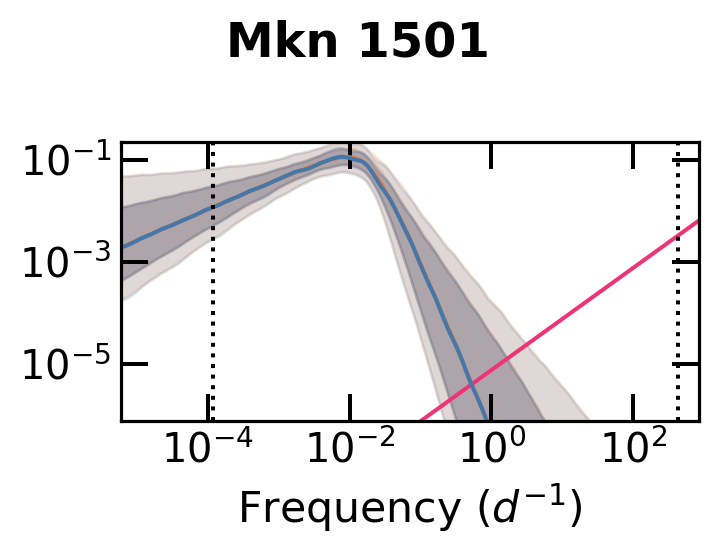
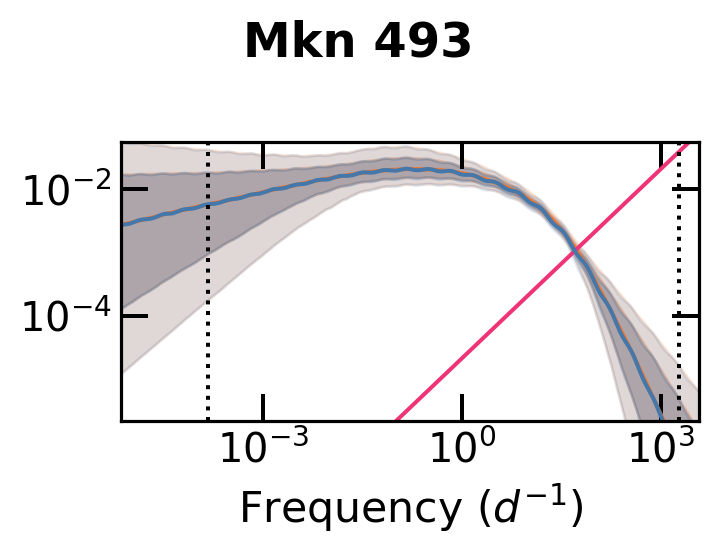
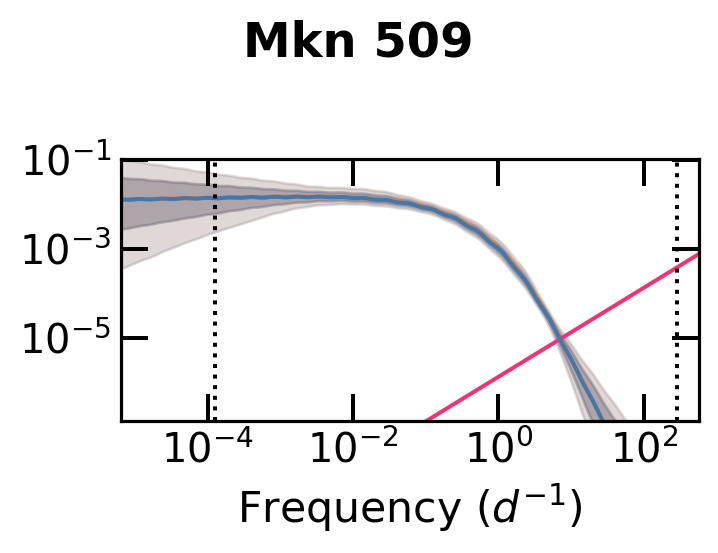
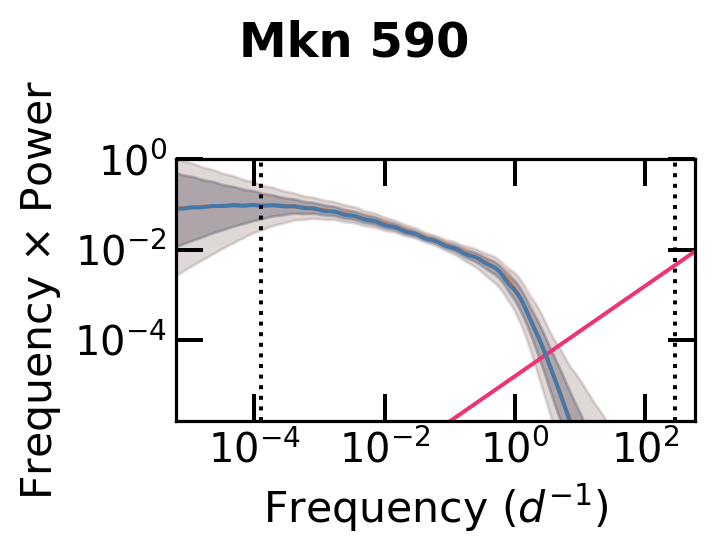
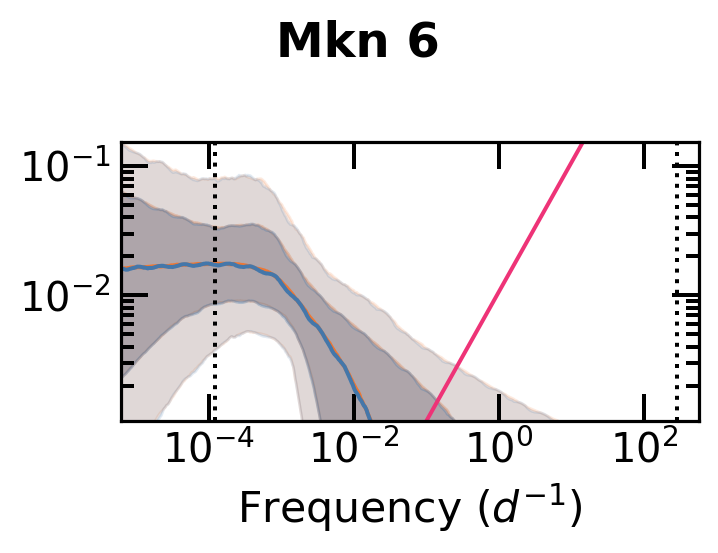
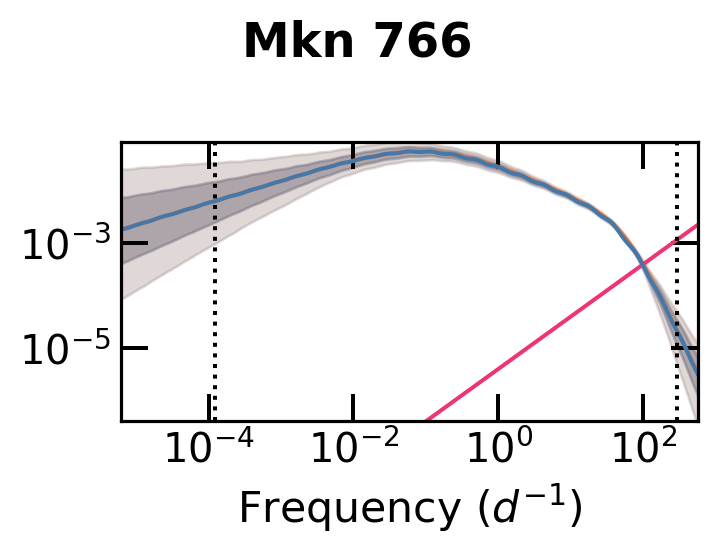
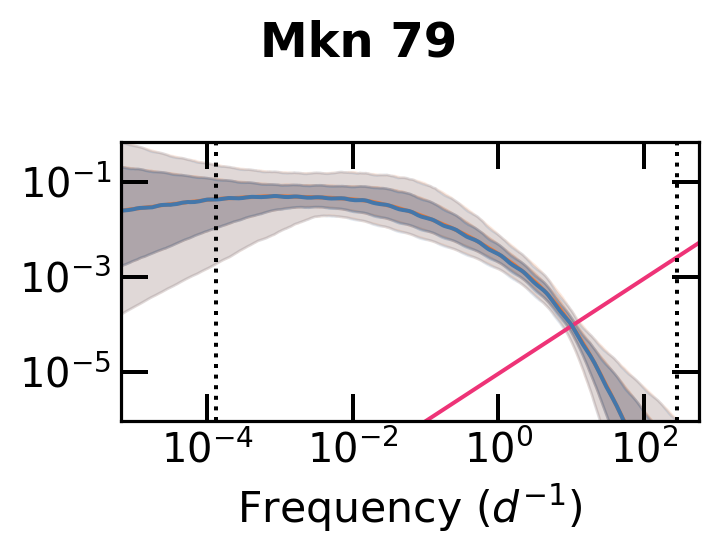
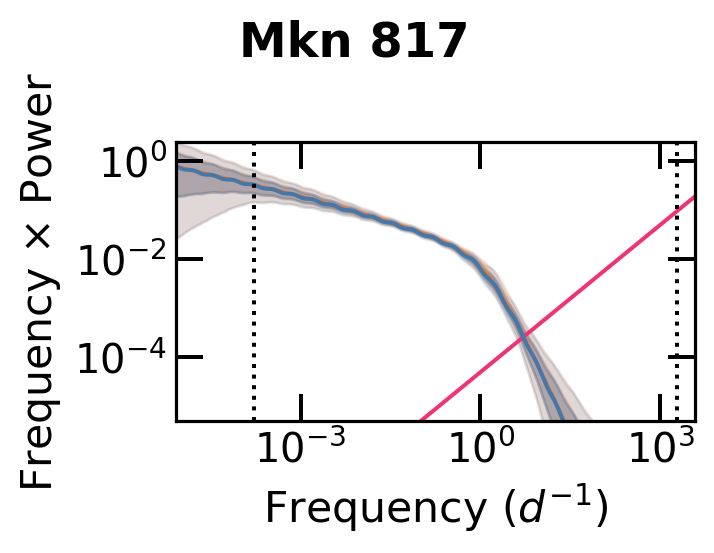
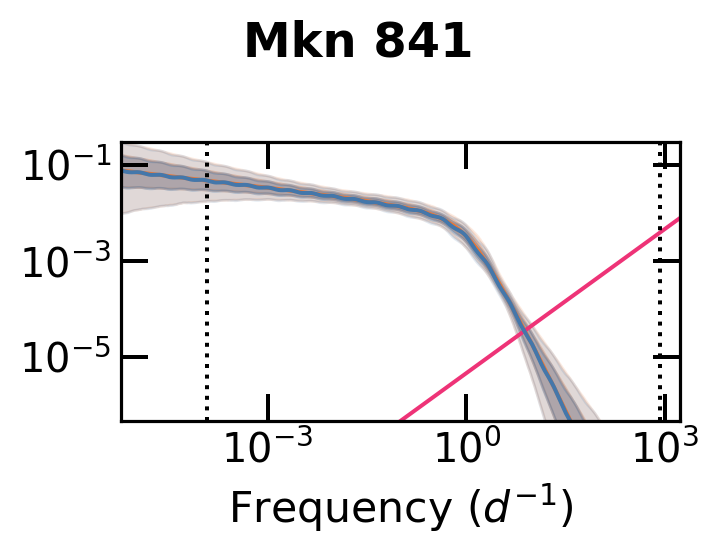
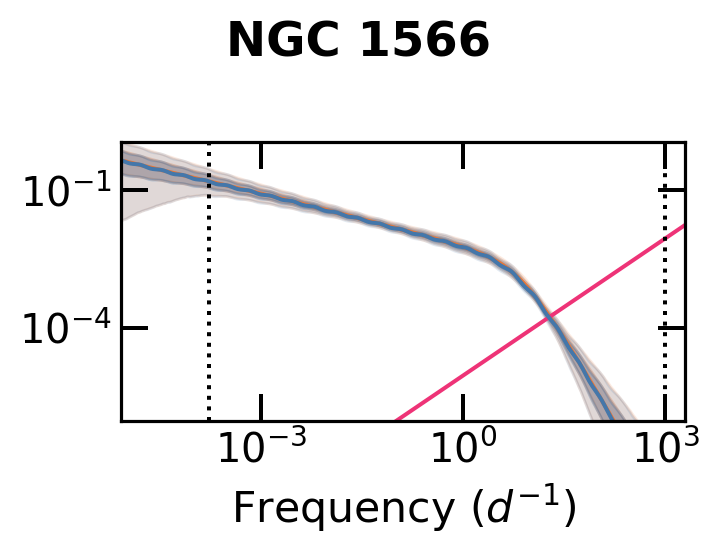
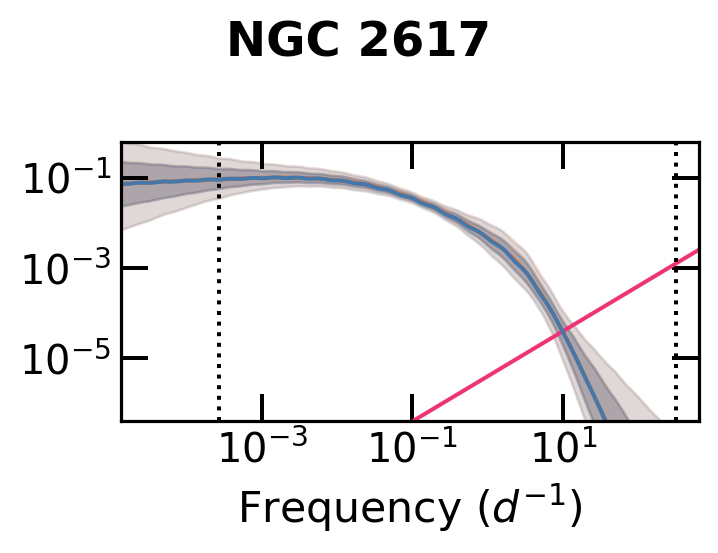
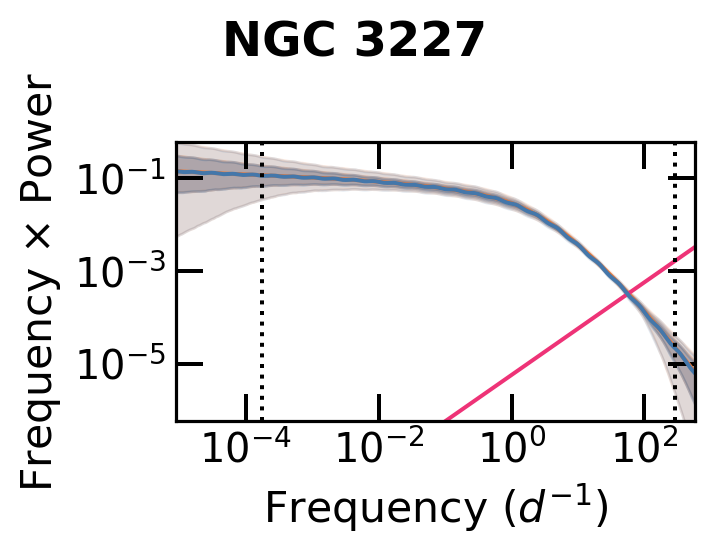
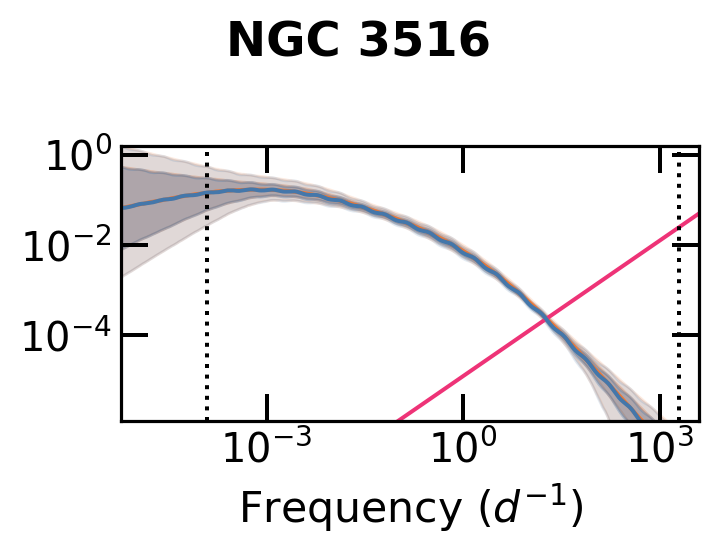
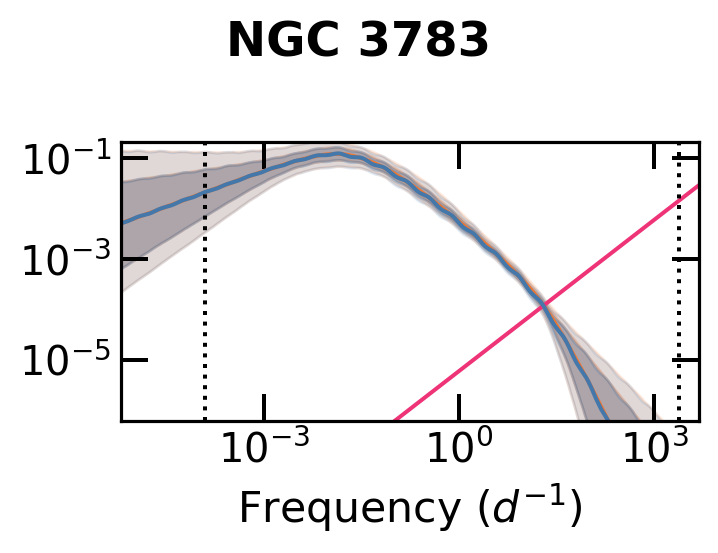
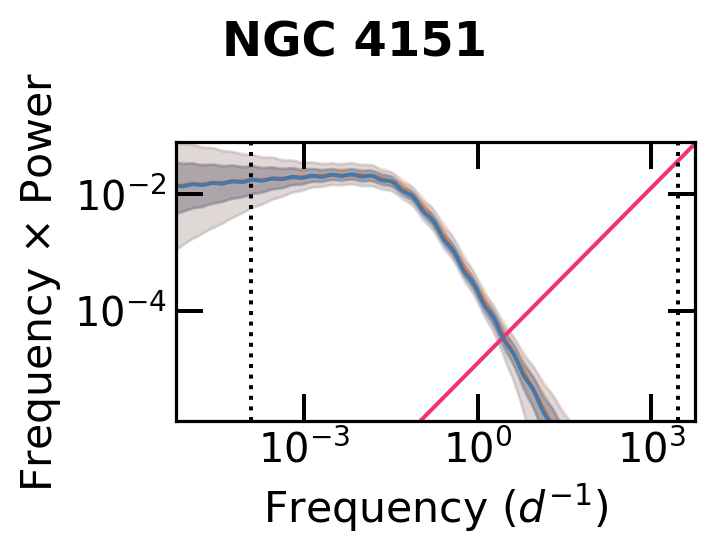
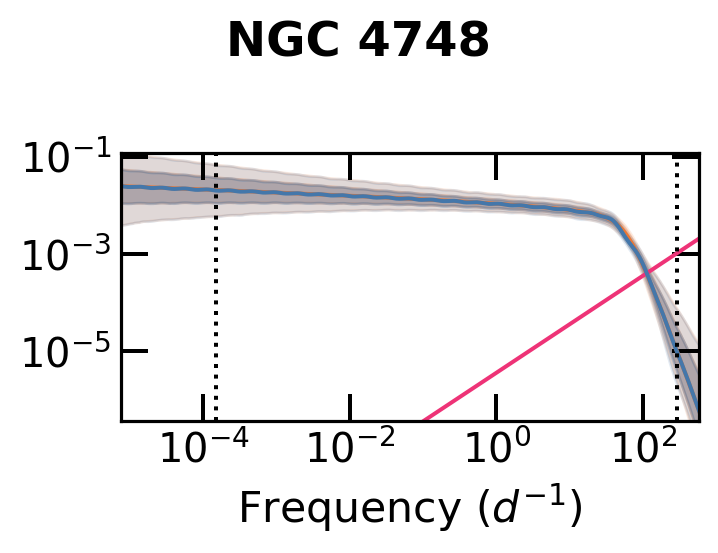
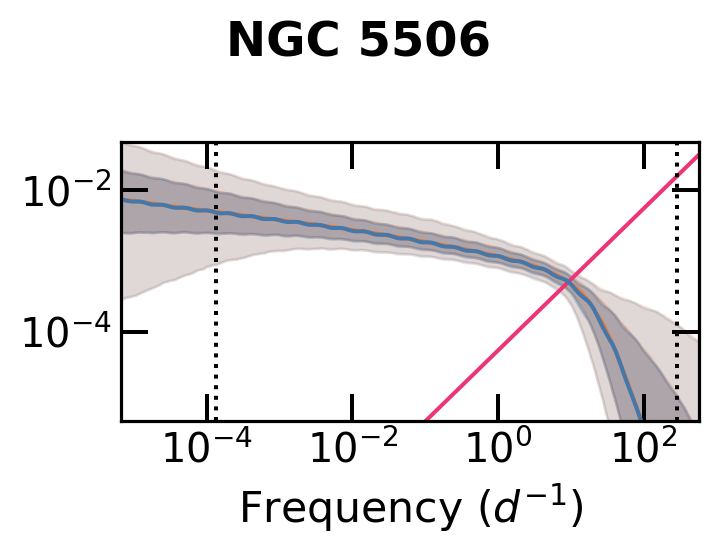
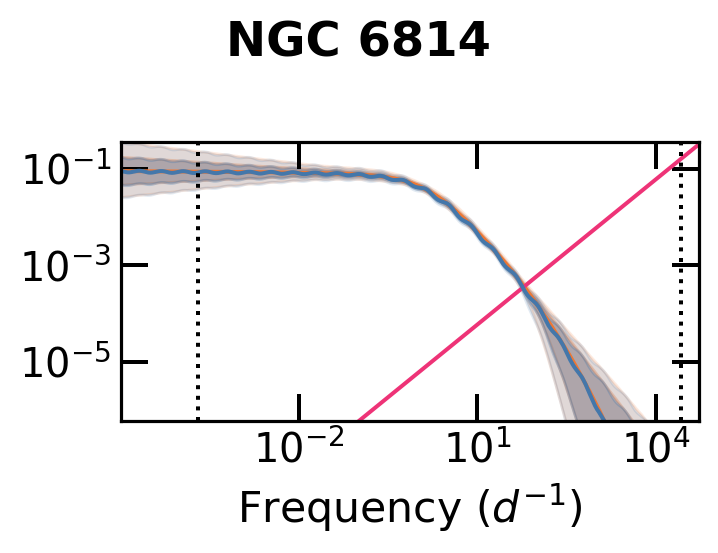
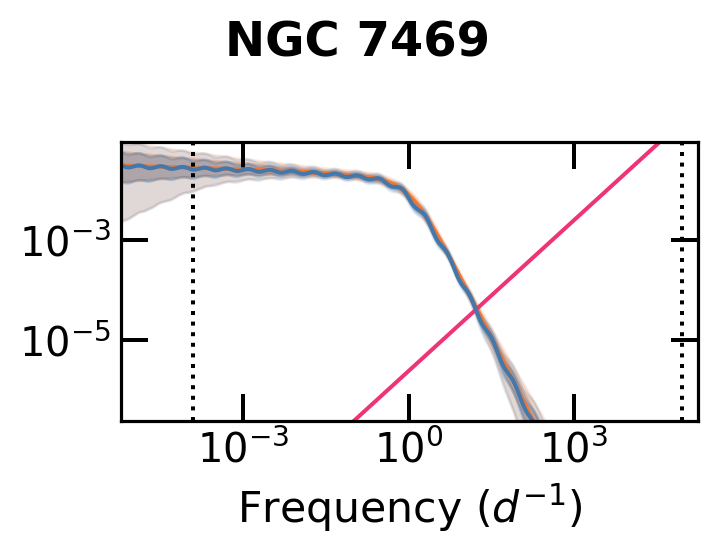
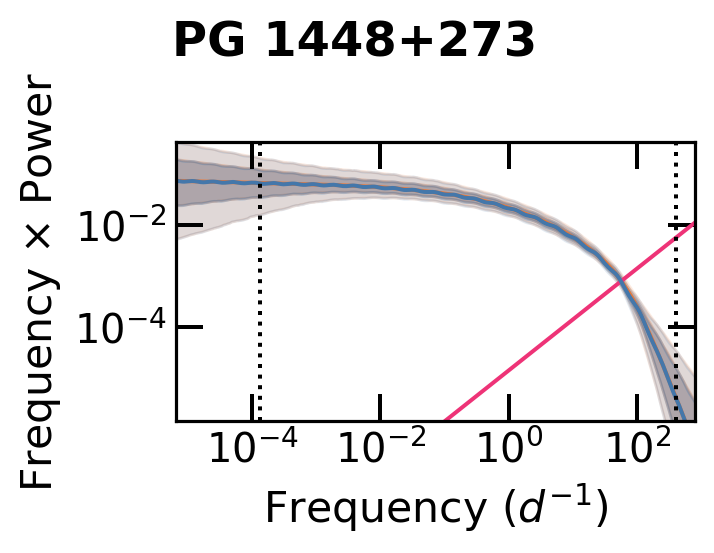
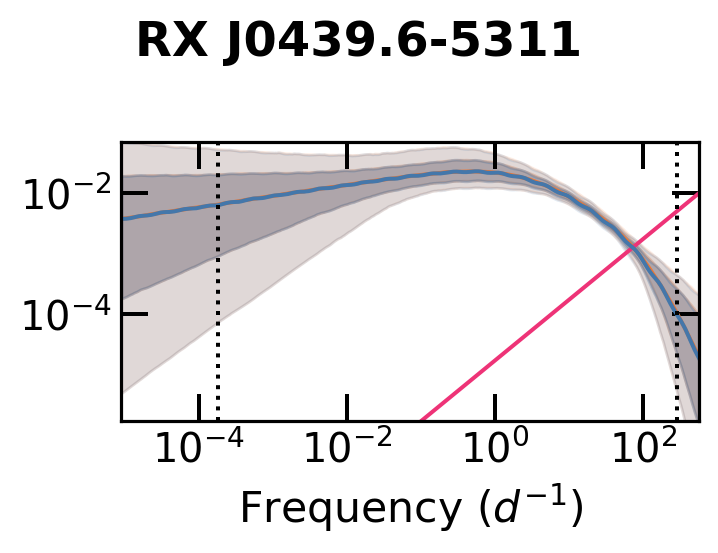
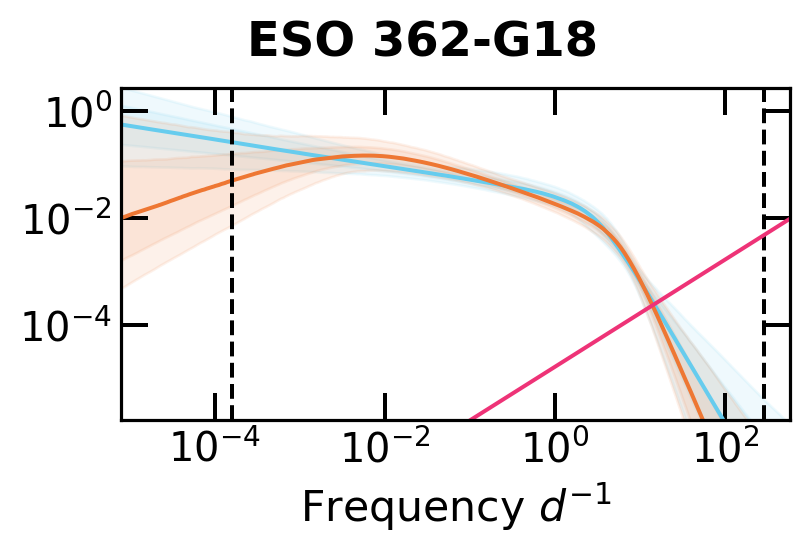
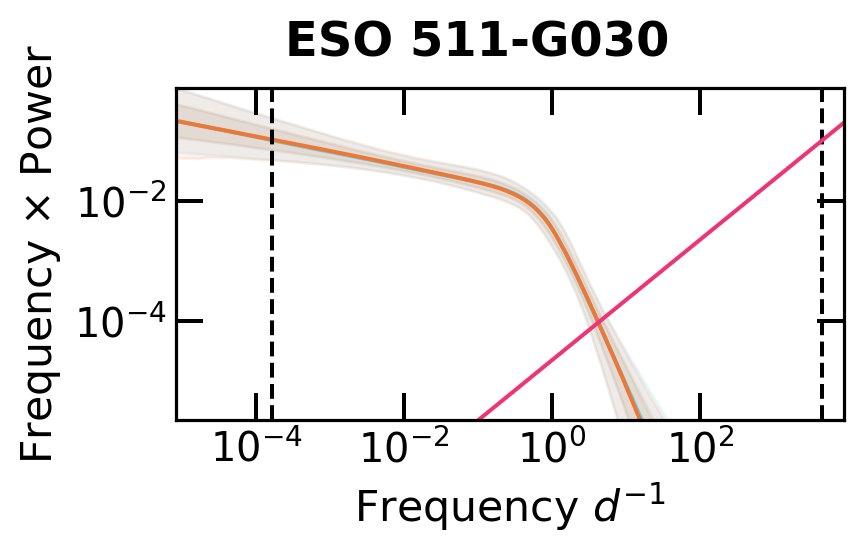
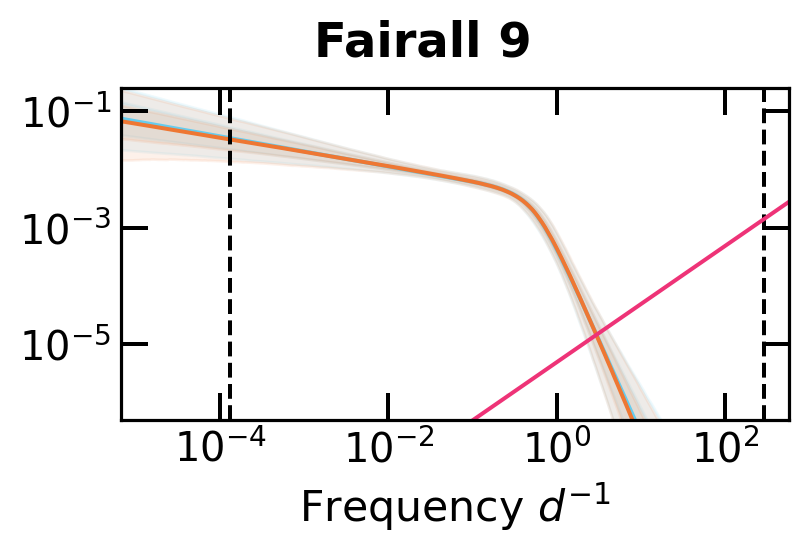
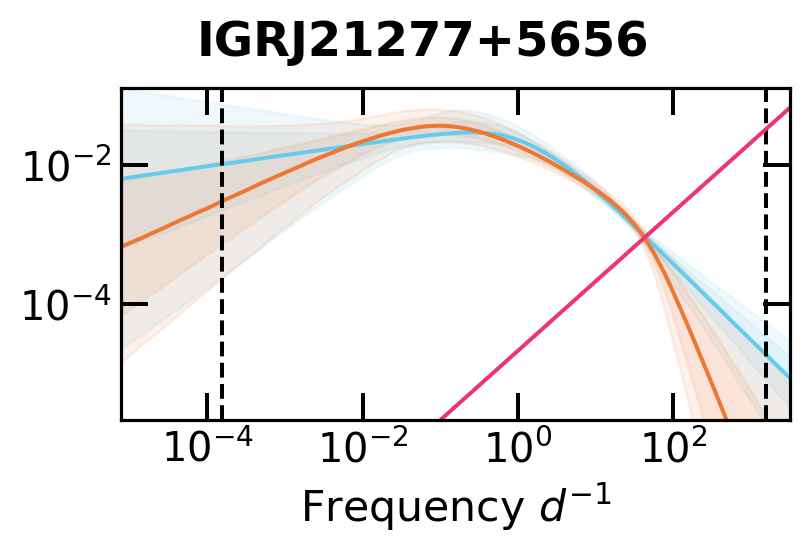
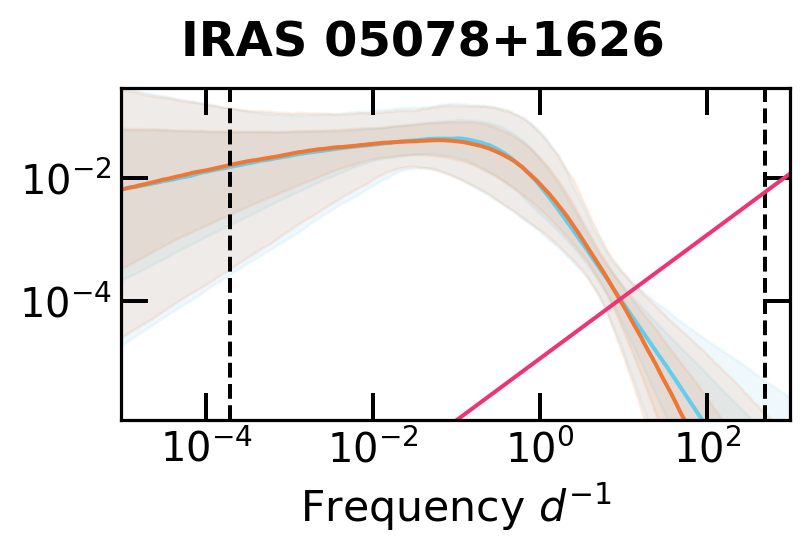
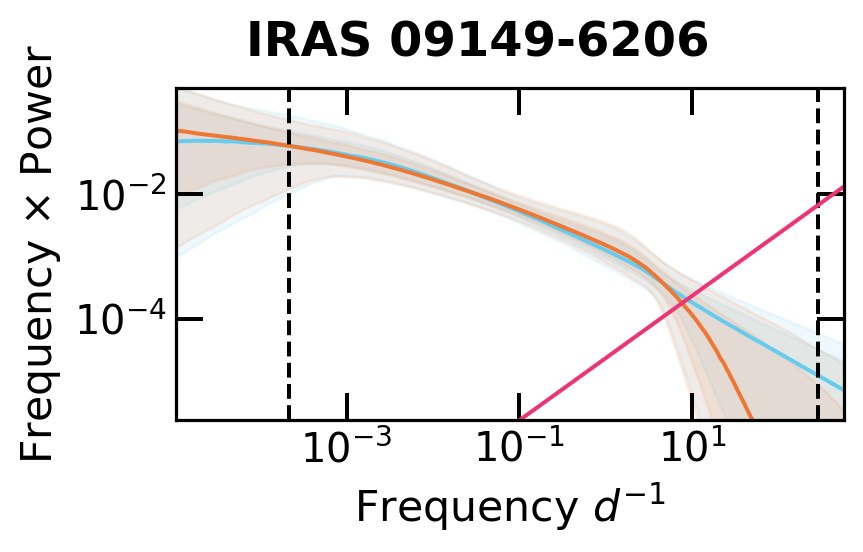
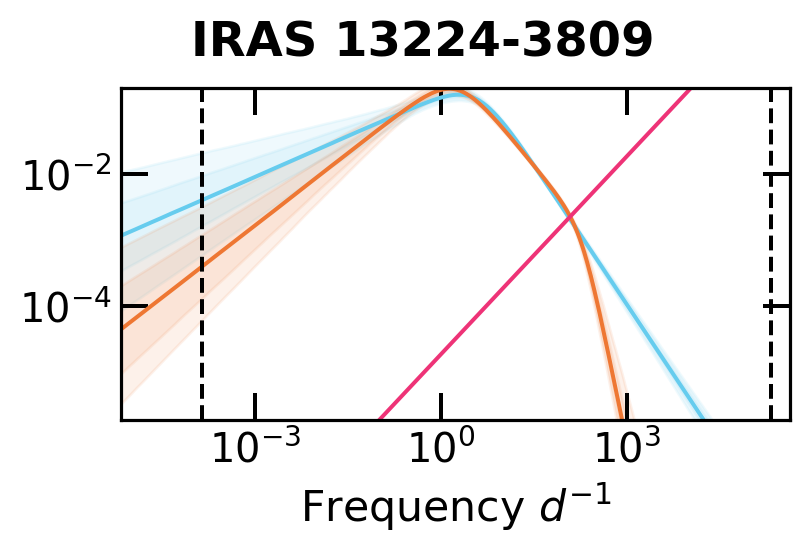
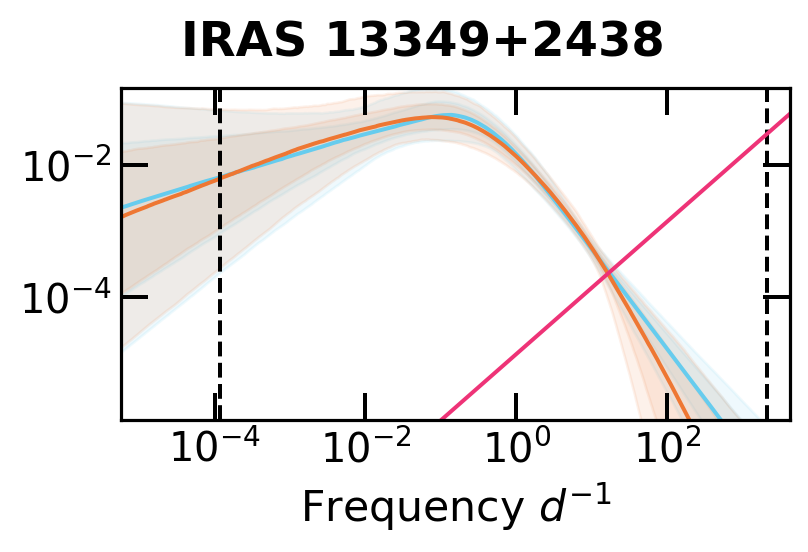
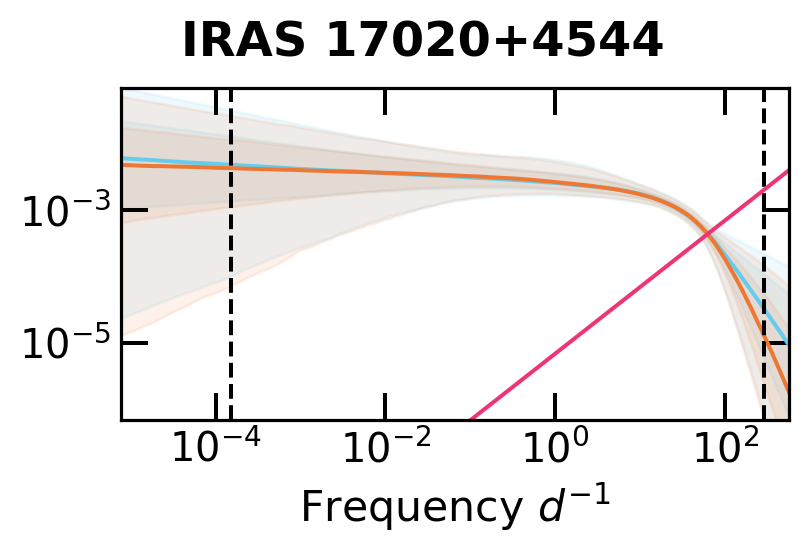
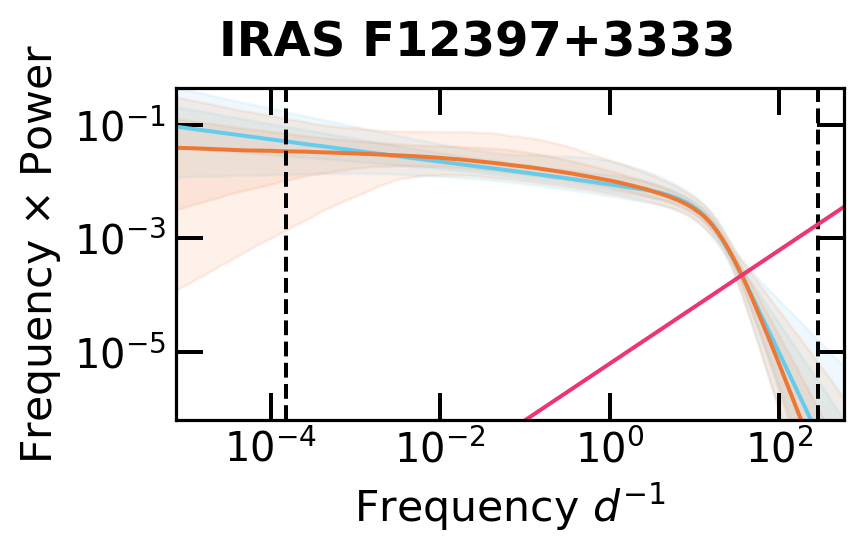
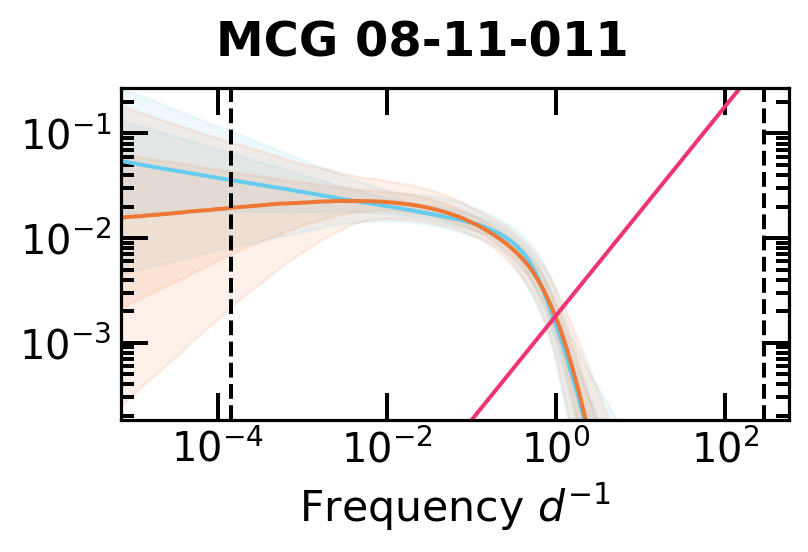
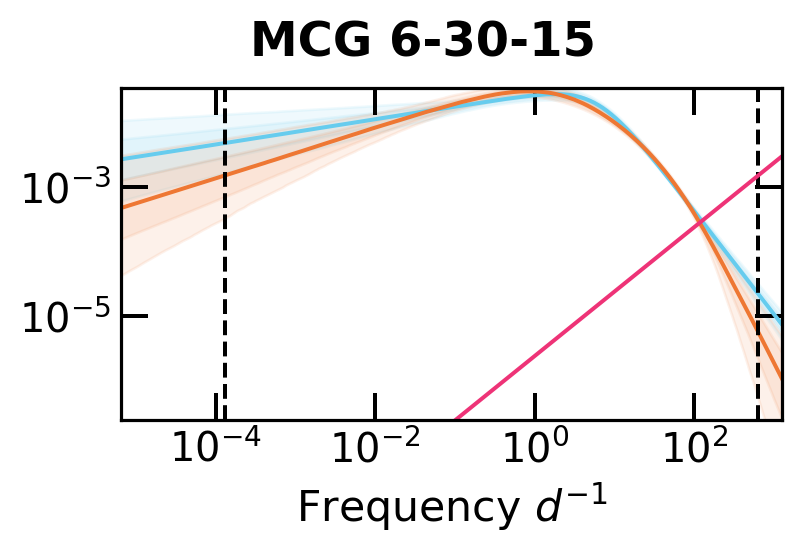
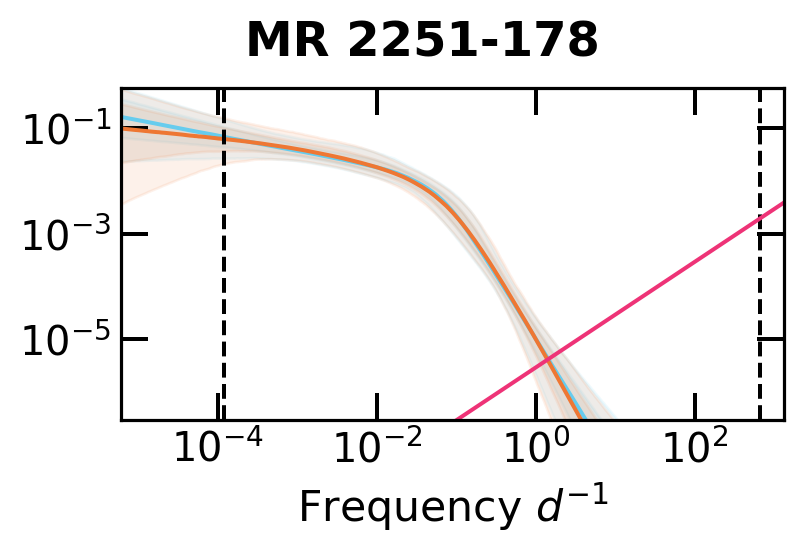
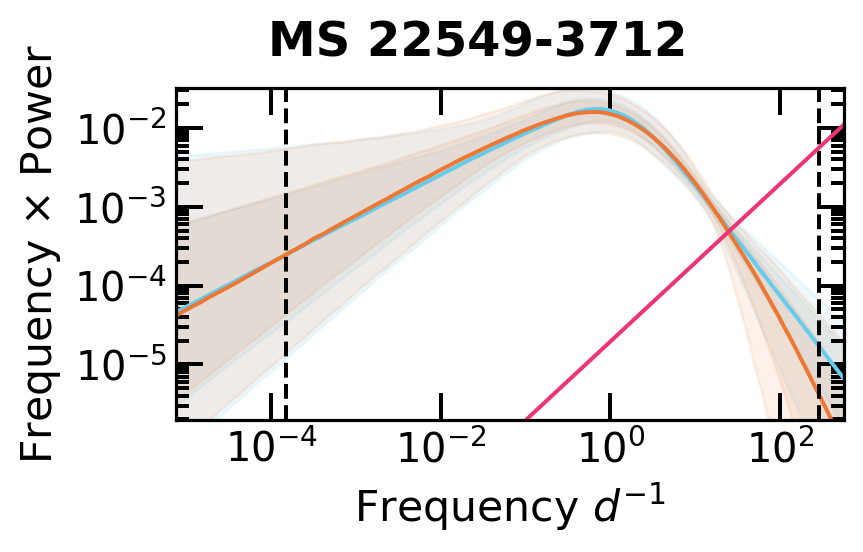
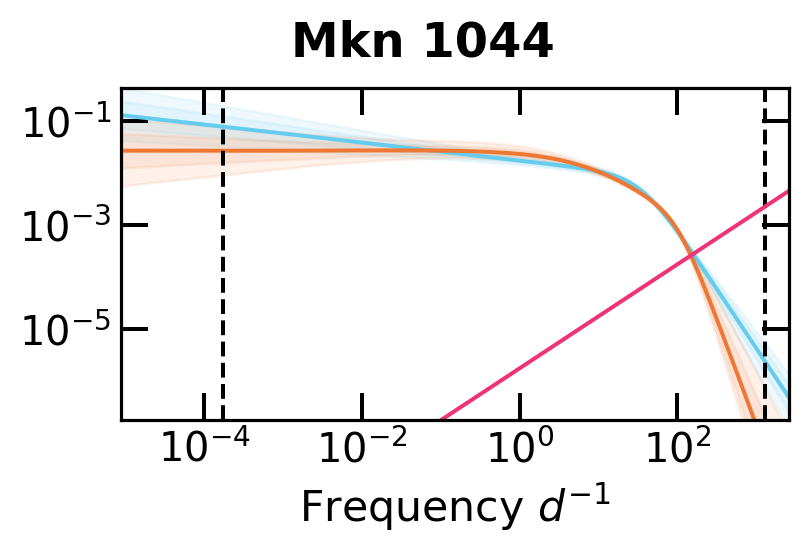
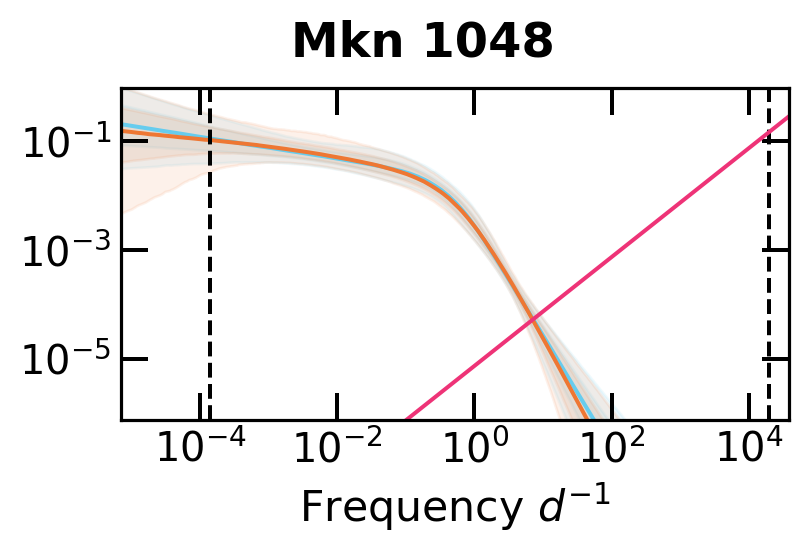
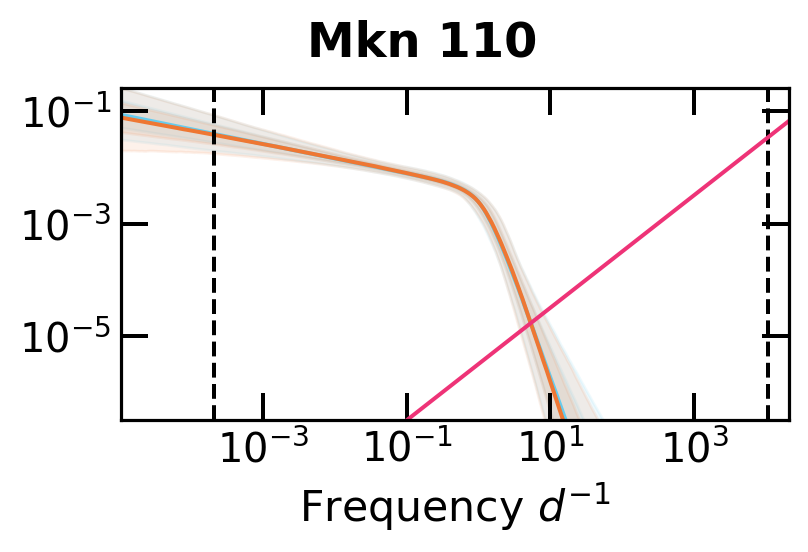
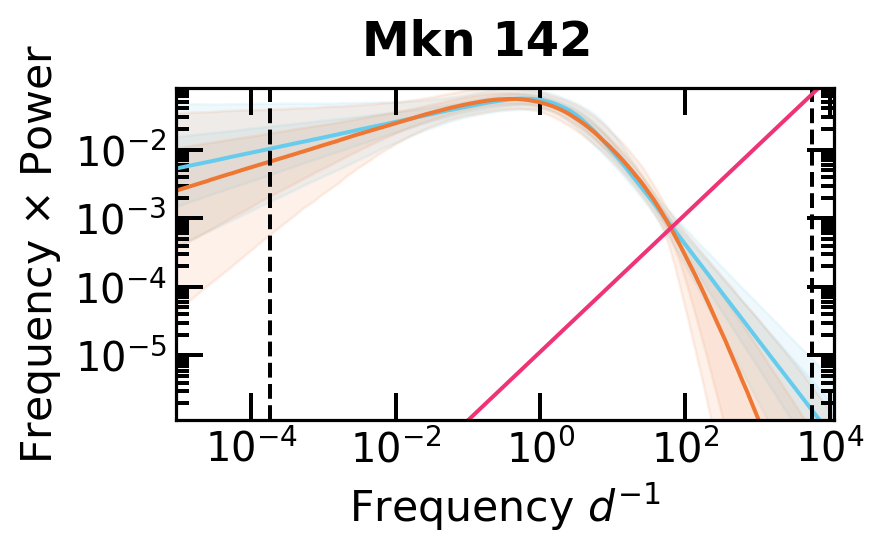
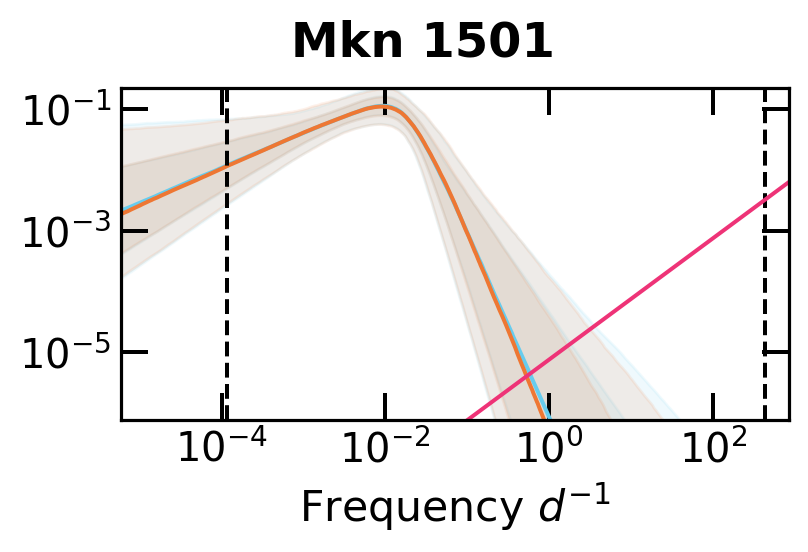
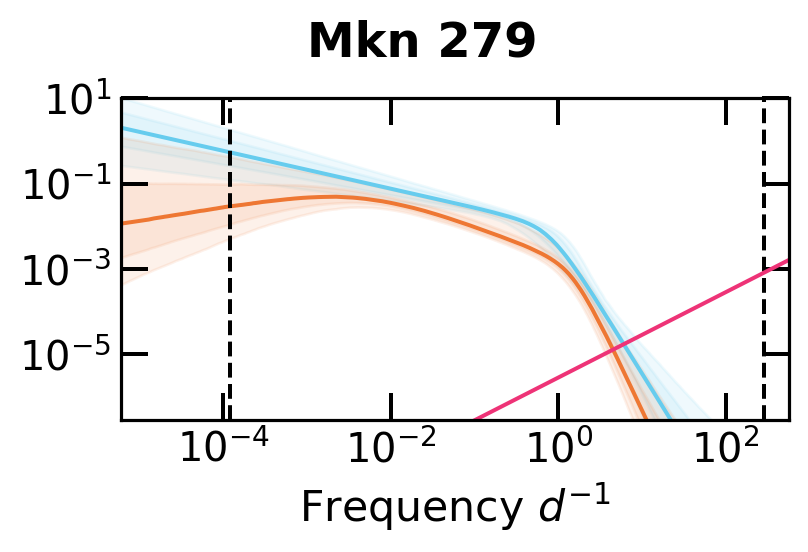
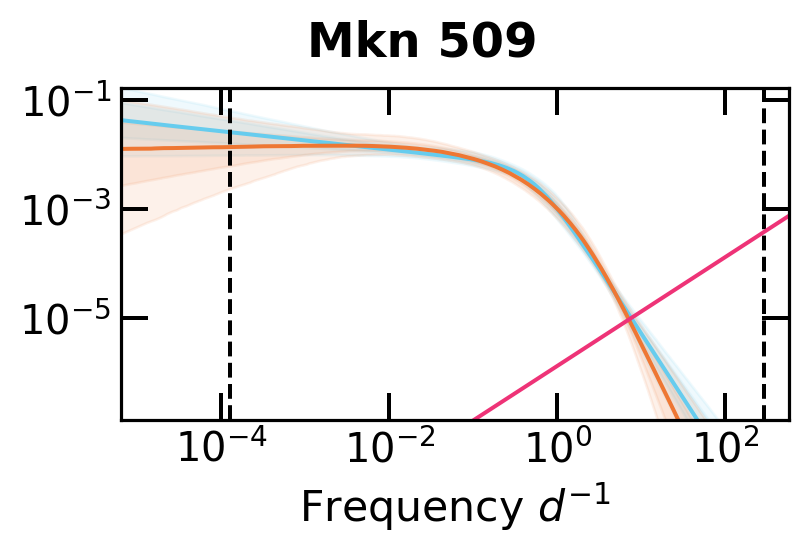
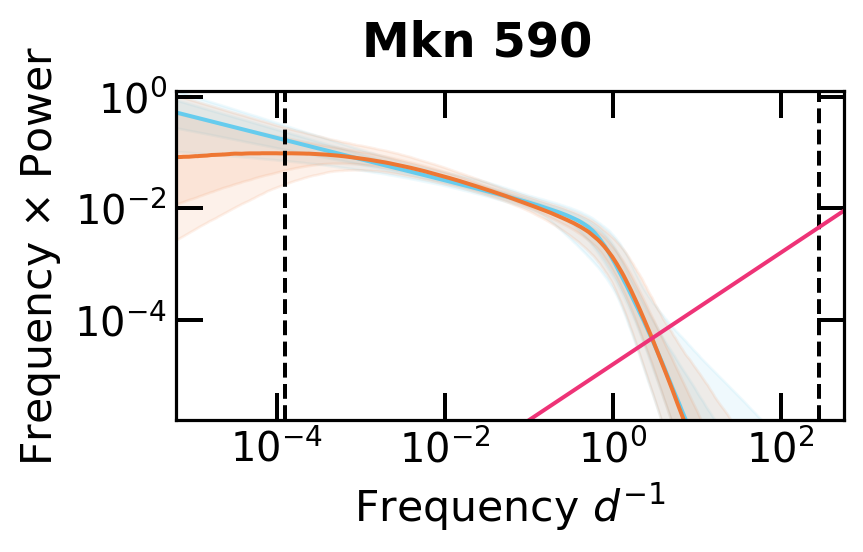
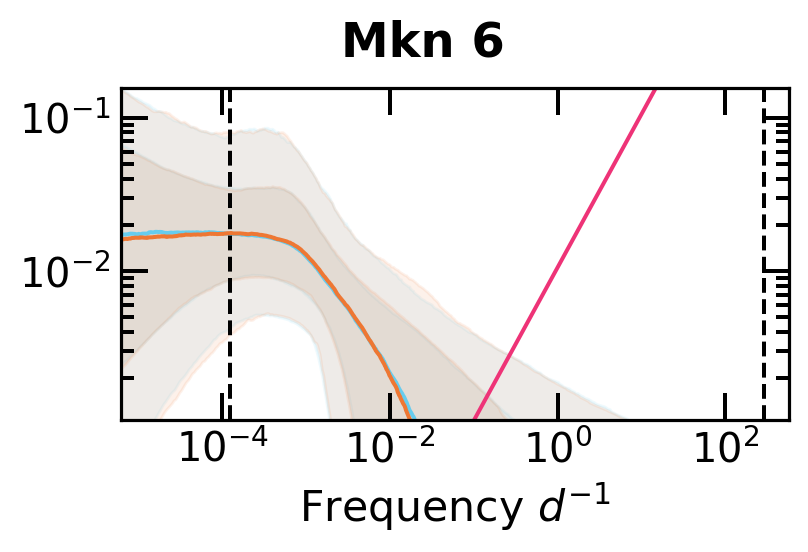
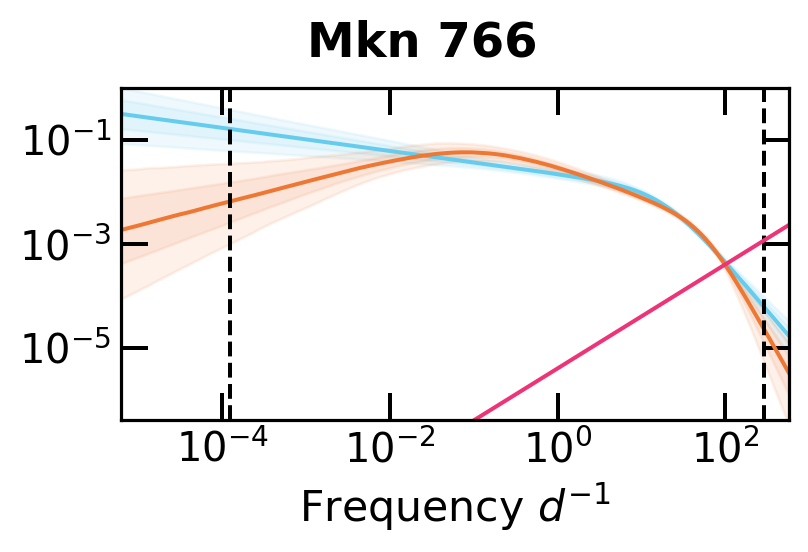
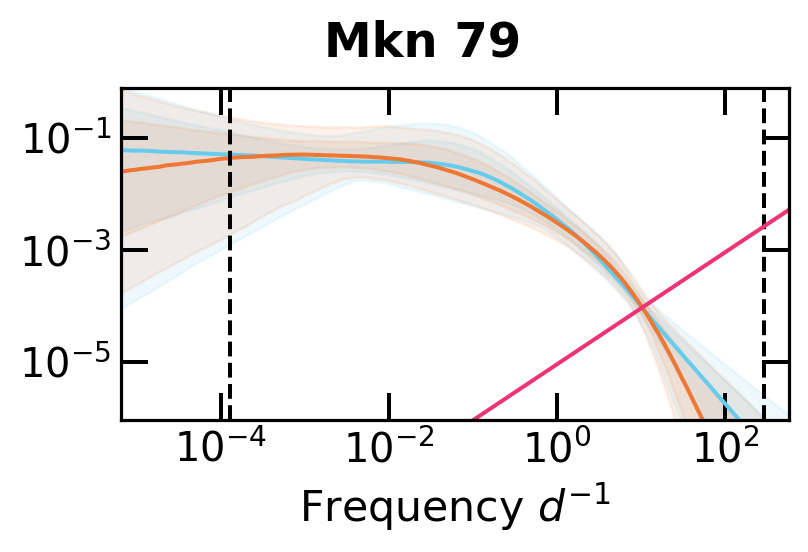
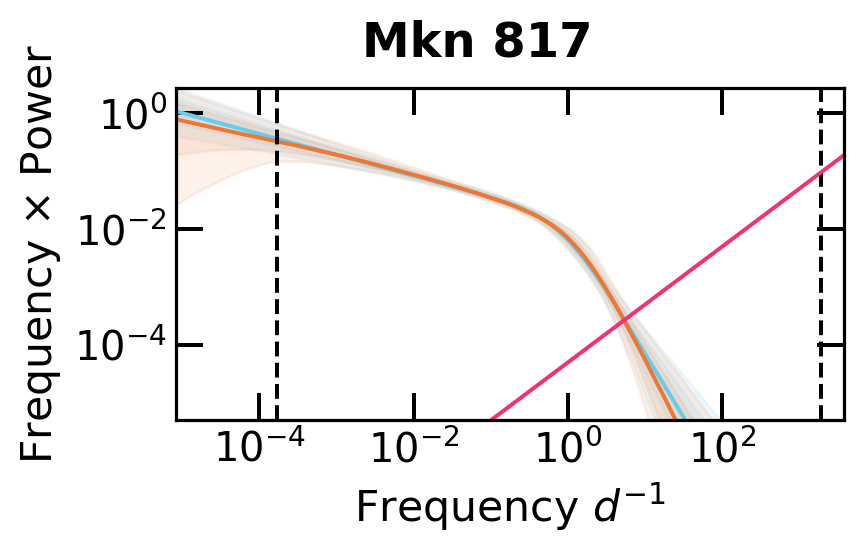
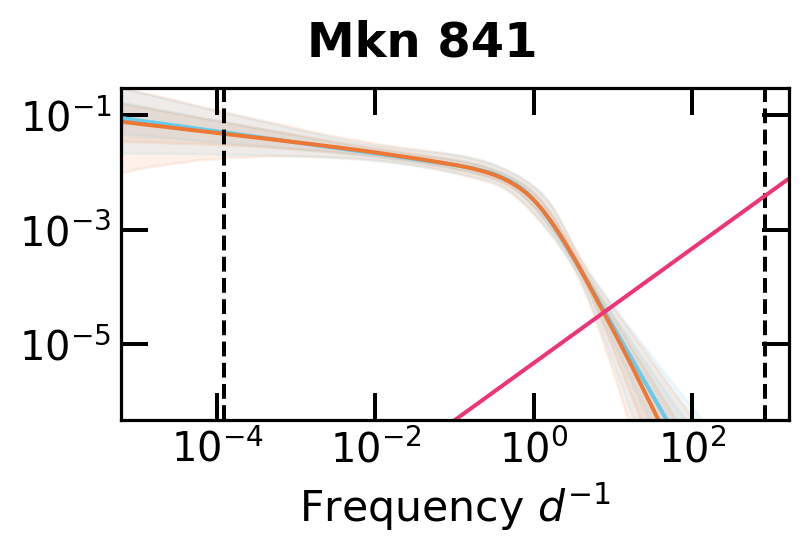
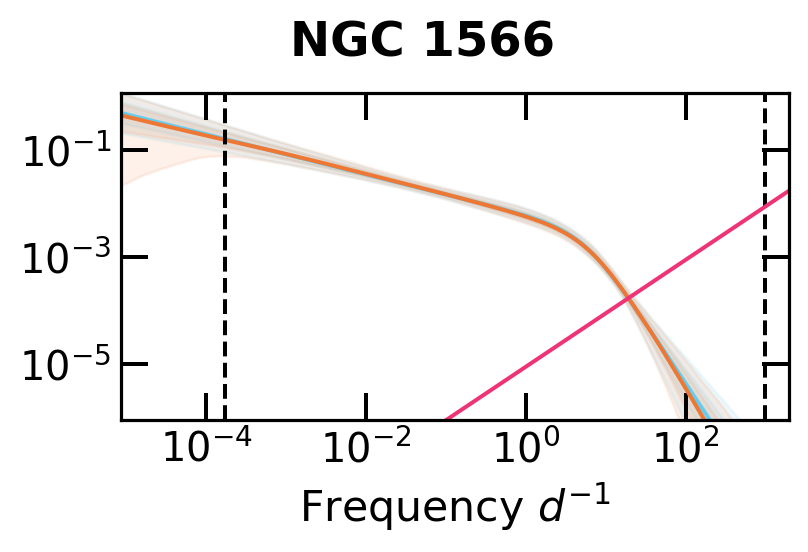
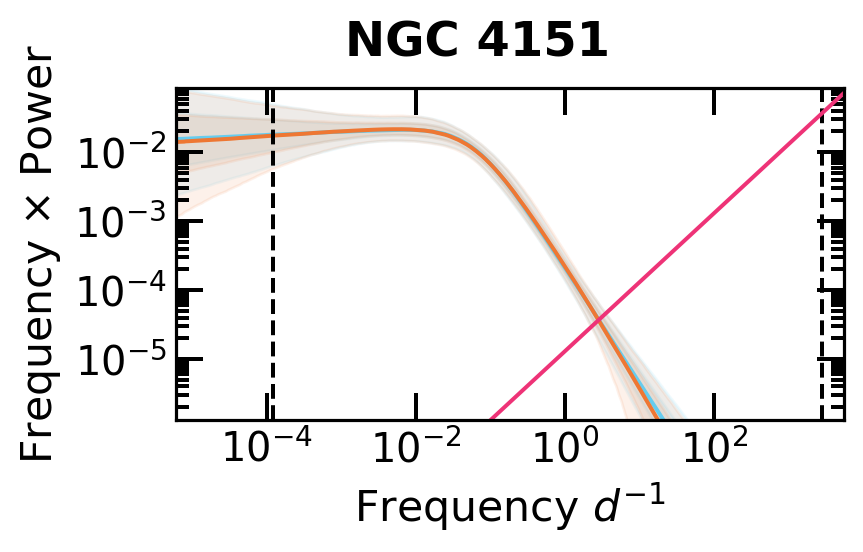
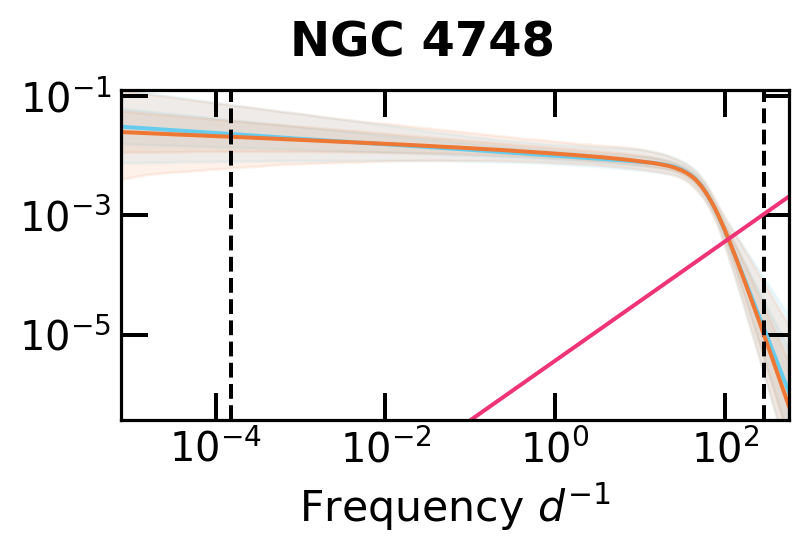
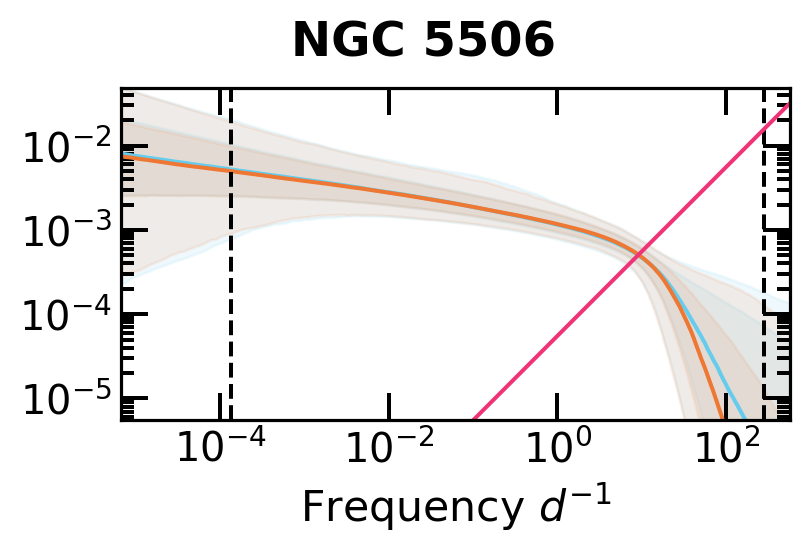
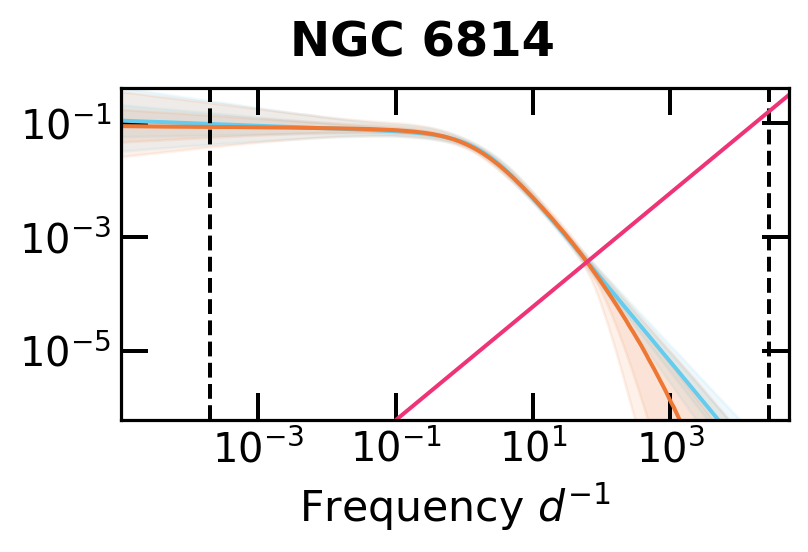
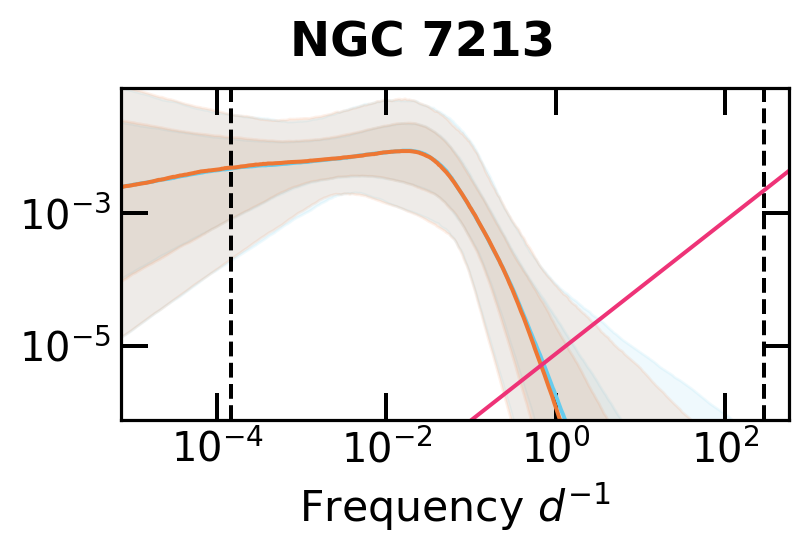
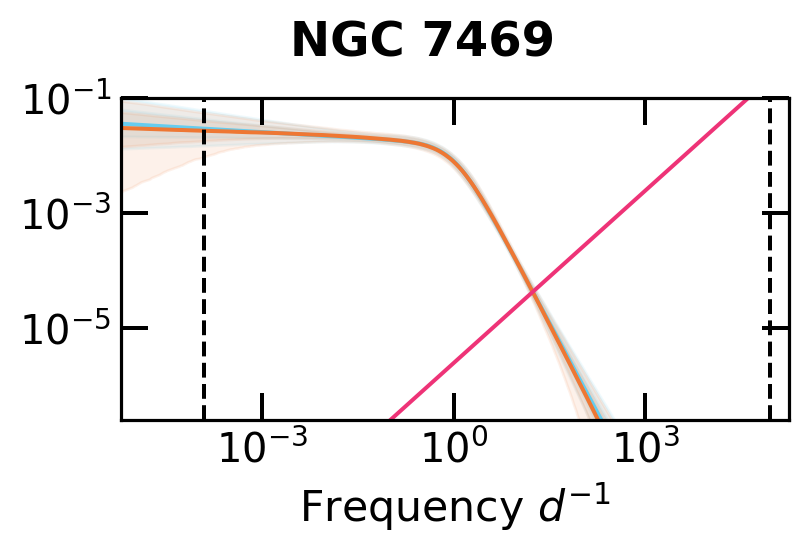
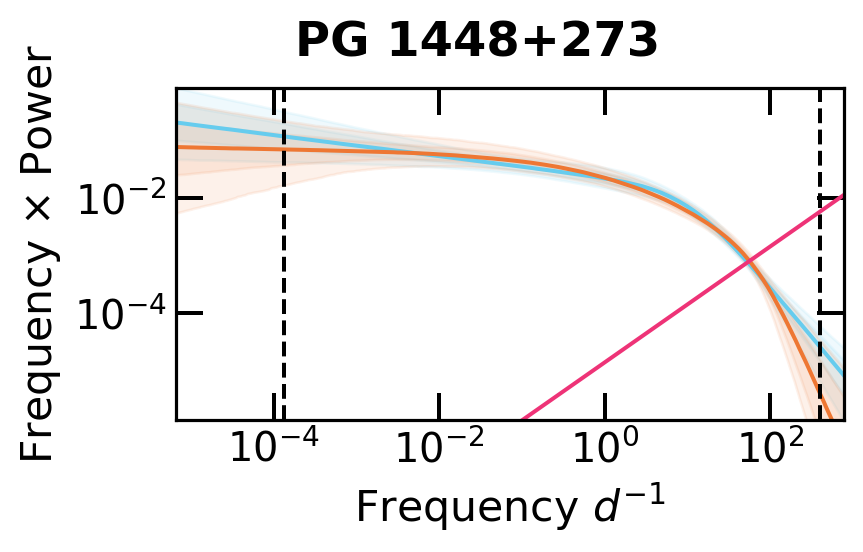
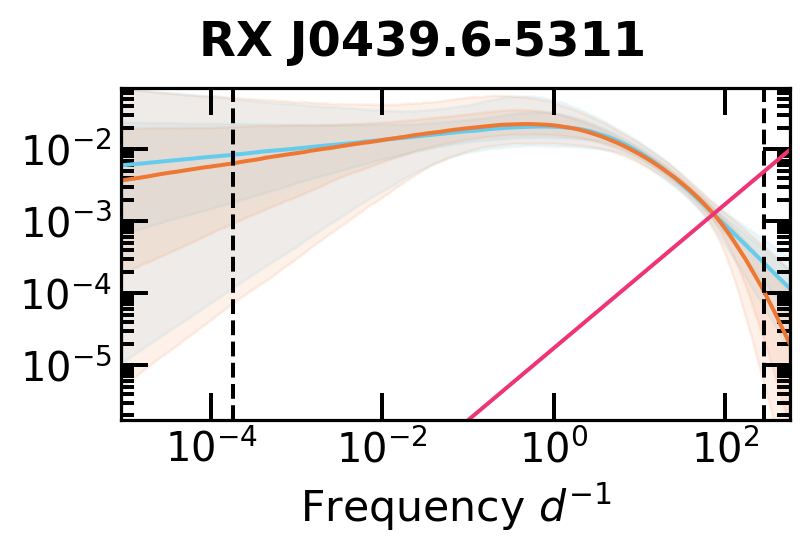
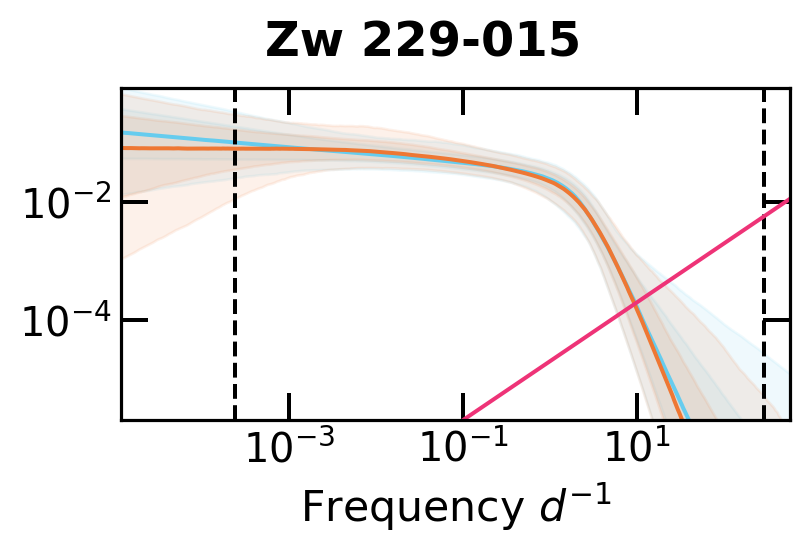
Here we plot all the posterior predictive power spectra for all sources and models. We also compare the single-bending and double-bending models.
```{python}
import arviz as az
import numpy as np
import glob
import os
import json
import csv
import pandas as pd

import matplotlib.pyplot as plt
plt.style.use("https://github.com/mlefkir/beauxgraphs/raw/main/beautifulgraphs_colblind.mplstyle")
from agnvar import clean_dataframe,prettyname2dirname,dirname2prettyname,find_spectral_str, replot_lsp_ppc,replot_psd_ppc,plot_posterior_density,replot_psd_overplot

plt.rcParams.update({'figure.max_open_warning': 0})

sources = pd.read_csv('website_sources_data.csv')

sources_list = sources["Object"].values.tolist()
dir_list = [prettyname2dirname(source) for source in sources_list]
energies = ["0.3-1.5"]
path = "/home/mehdy/github/Paper_II/website/inference/"
band = "0.3-1.5"
```
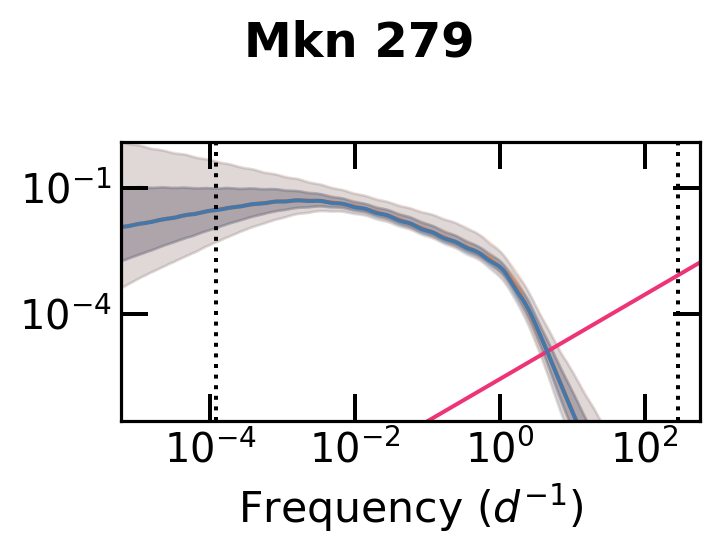
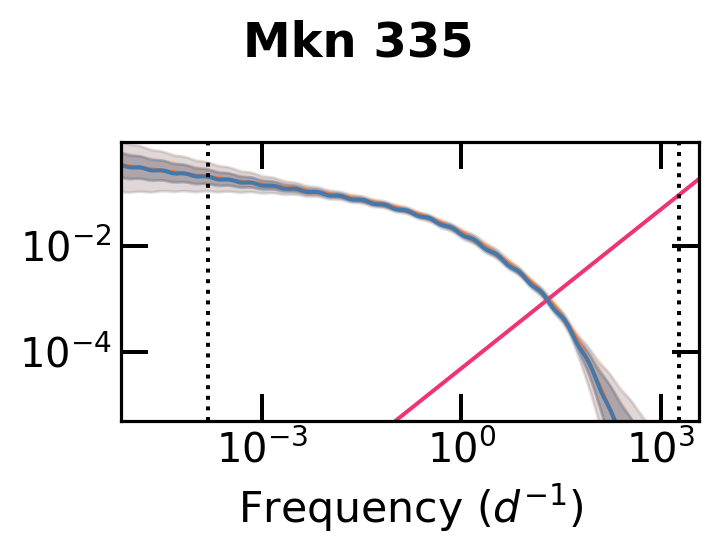
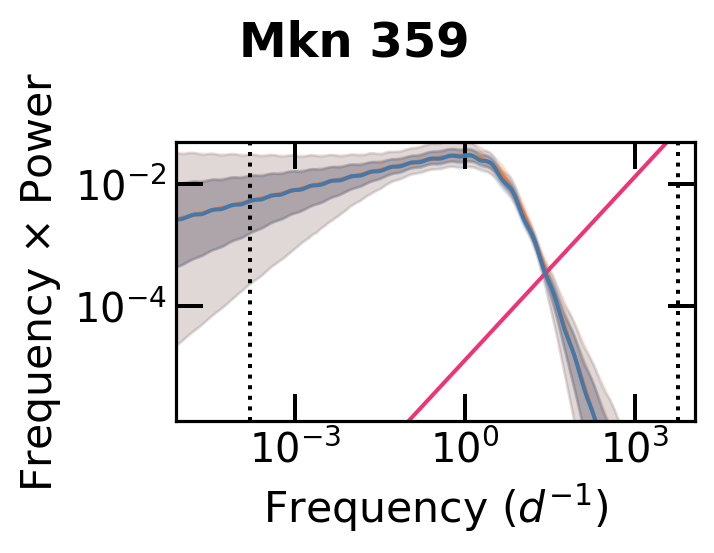
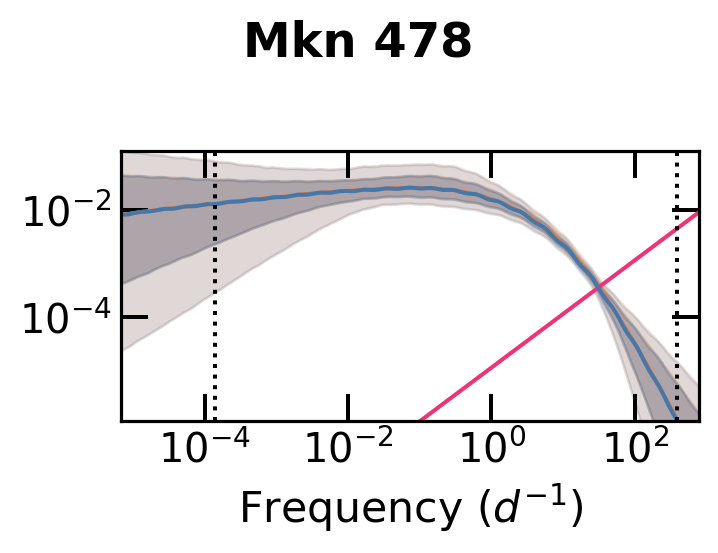
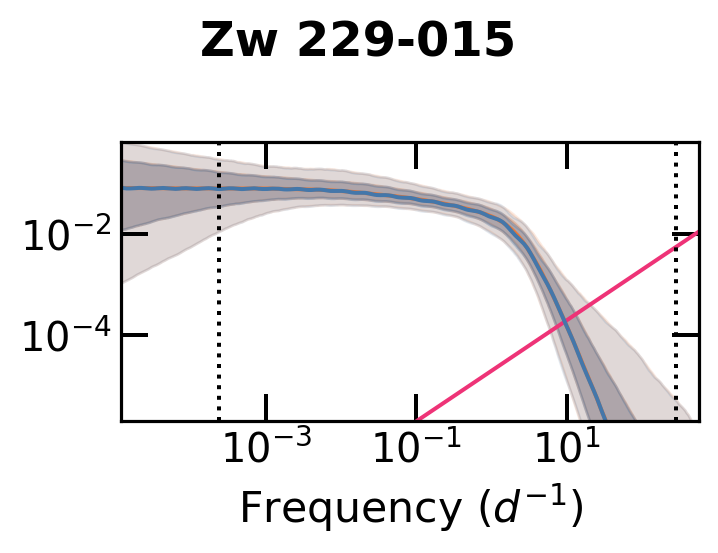
## Single bending power-law
```{python}
#| layout-ncol: 4
model = "single_steep"
short_model = "single"

single_dirs = [f"{path}/{source}_combined_{band}_{short_model}_123_factor/chains/equal_weighted_post.txt" for source in dir_list]


for i,dir in enumerate(single_dirs[:]):
    source = dir_list[i]
    path_single_plots = f"{path}/{source}_combined_{band}_{short_model}_123_factor/plots/"

    t,y,yerr = np.genfromtxt(f"{path}/{source}_combined_{band}_{short_model}_123_factor/{source}_combined_{band}_{short_model}_subset_time_series.txt", unpack=True)
    f_min,f_max = 1/(t[-1]-t[0]), 1/(2*np.min(np.diff(t)))

    A = np.genfromtxt(f"{path_single_plots}/psd_ppc_data.txt").T
    f_P = find_spectral_str(f"{path_single_plots}/psd_ppc_data.txt")
    psd_noise_levels = [2*np.median((yerr/y)**2)*np.median(np.diff(t))]
    f,psd_quantiles,psd_approx_quantiles = A[:, 0], A[:, 1:6], A[:, 6:]
    fig1,ax1 = replot_psd_ppc(f, psd_quantiles, psd_approx_quantiles, psd_noise_levels, f_min, f_max,f_P=f_P,title=f"{dirname2prettyname(source)}" )
    fig1.suptitle(f"{dirname2prettyname(source)}")
    ax1.get_legend().remove()
    fig1.set_size_inches(4.25, 3)
    ax1.set_ylabel(r"F $\times$ Power")
    if i %4 !=0:
        ax1.set_ylabel("")
    fig1.tight_layout()
```
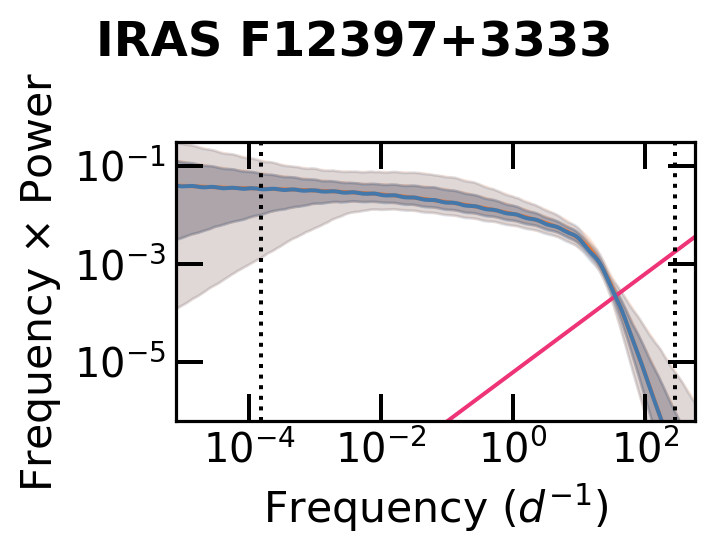
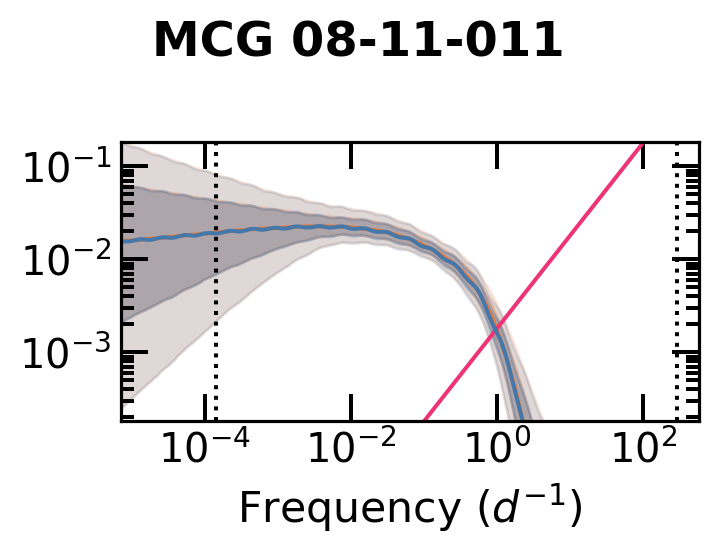
## Double bending power-law
```{python}
#| layout-ncol: 4
model = "double_steep"
short_model = "double"

double_dirs = [f"{path}/{source}_combined_{band}_{short_model}_123_factor/chains/equal_weighted_post.txt" for source in dir_list]

for i,dir in enumerate(double_dirs[:]):
    source = dir_list[i]
    if os.path.exists(dir):

        path_double_plots = f"{path}/{source}_combined_{band}_{short_model}_123_factor/plots/"

        t,y,yerr = np.genfromtxt(f"{path}/{source}_combined_{band}_{short_model}_123_factor/{source}_combined_{band}_{short_model}_subset_time_series.txt", unpack=True)
        f_min,f_max = 1/(t[-1]-t[0]), 1/(2*np.min(np.diff(t)))

        A = np.genfromtxt(f"{path_double_plots}/psd_ppc_data.txt").T
        f_P = find_spectral_str(f"{path_double_plots}/psd_ppc_data.txt")
        psd_noise_levels = [2*np.median((yerr/y)**2)*np.median(np.diff(t))]
        f_d,psd_quantiles_d,psd_approx_quantiles_d = A[:, 0], A[:, 1:6], A[:, 6:]

        fig2,ax2 = replot_psd_ppc(f_d, psd_quantiles_d, psd_approx_quantiles_d, psd_noise_levels, f_min, f_max,f_P=f_P,title=f"{dirname2prettyname(source)}" )
        fig2.suptitle(f"{dirname2prettyname(source)}")
        ax2.get_legend().remove()
        fig2.set_size_inches(4., 3)
        if i %4 !=0:
            ax2.set_ylabel("")
        fig2.tight_layout()
```
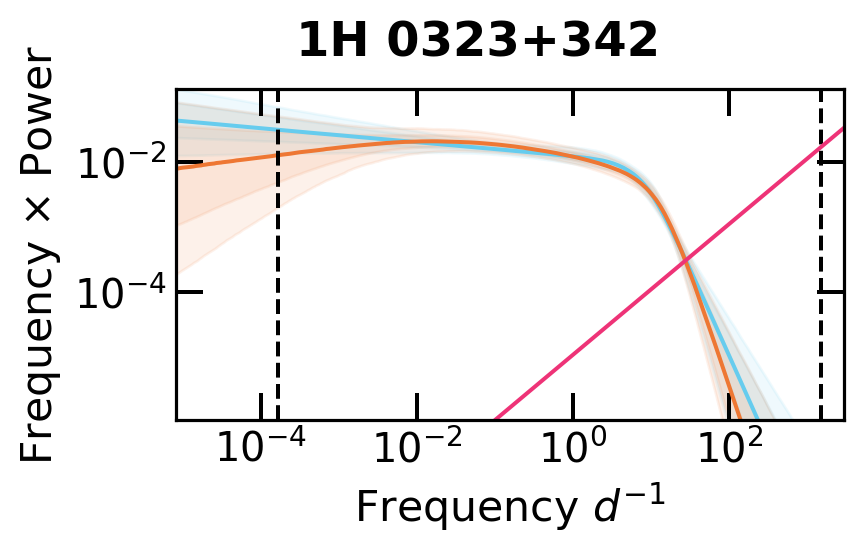
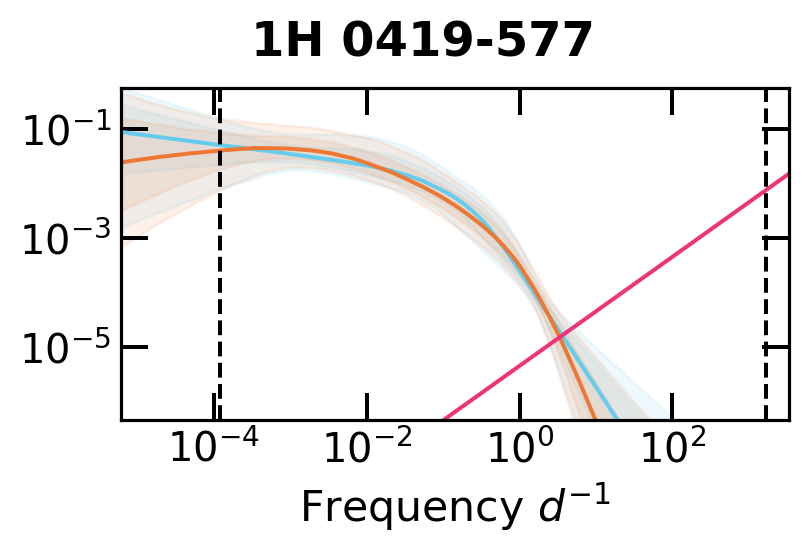
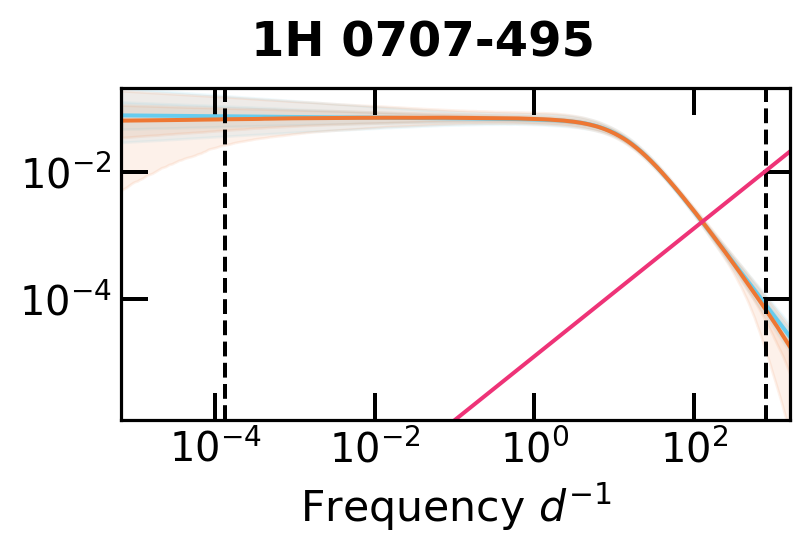
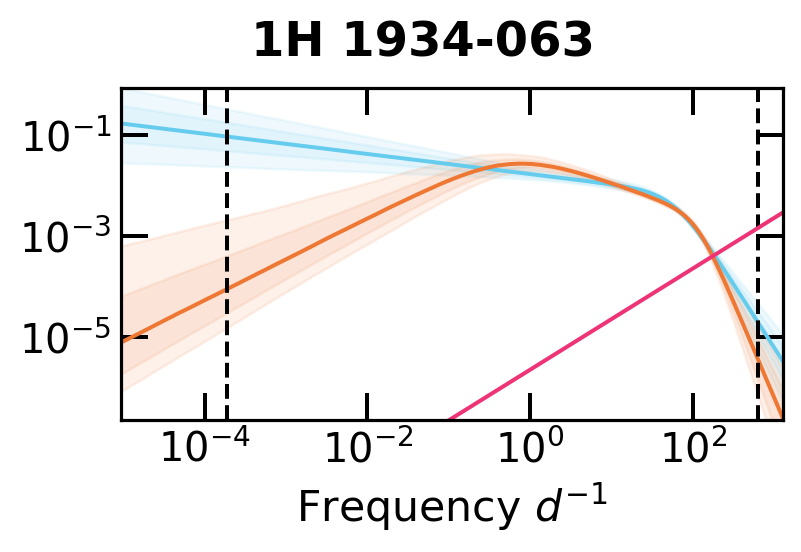
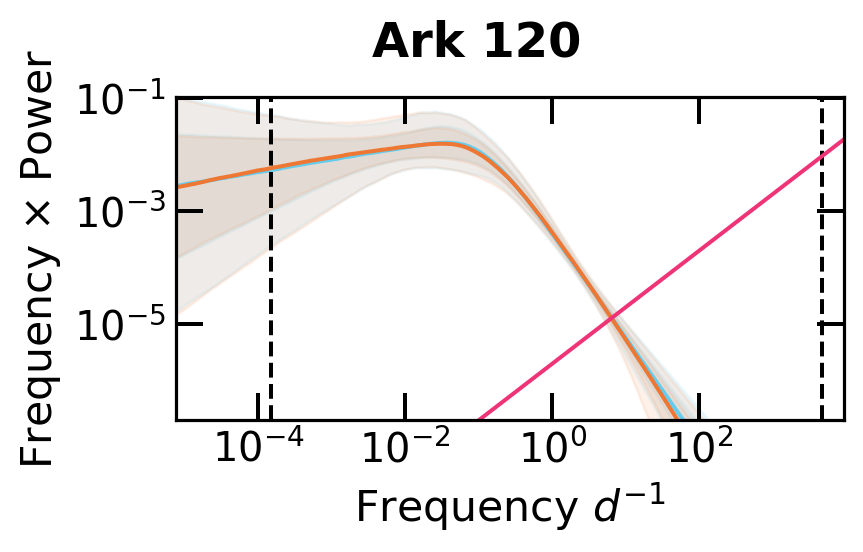
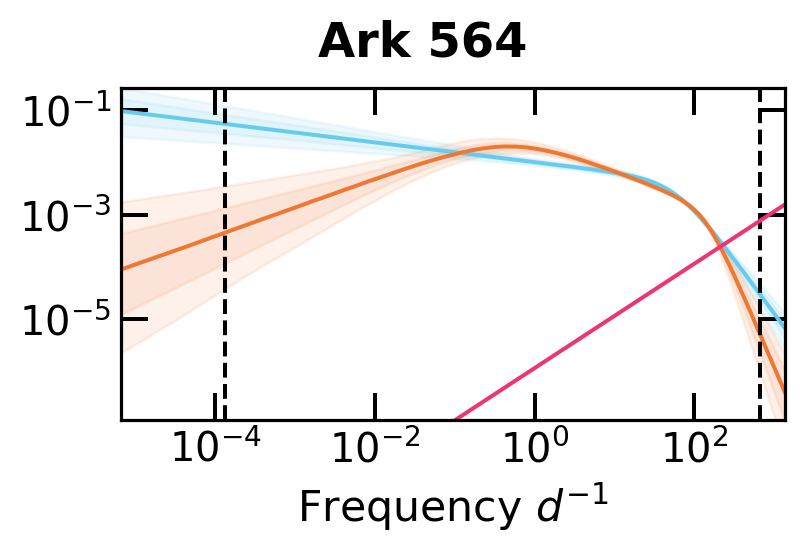
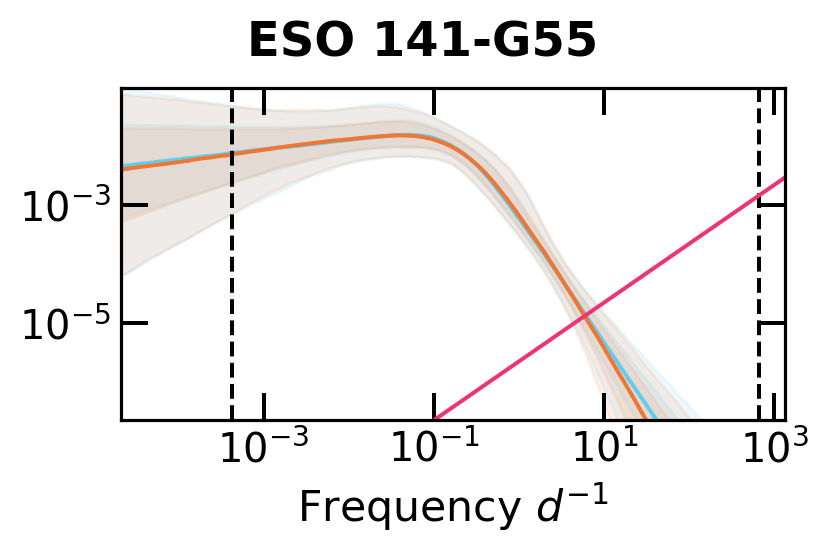
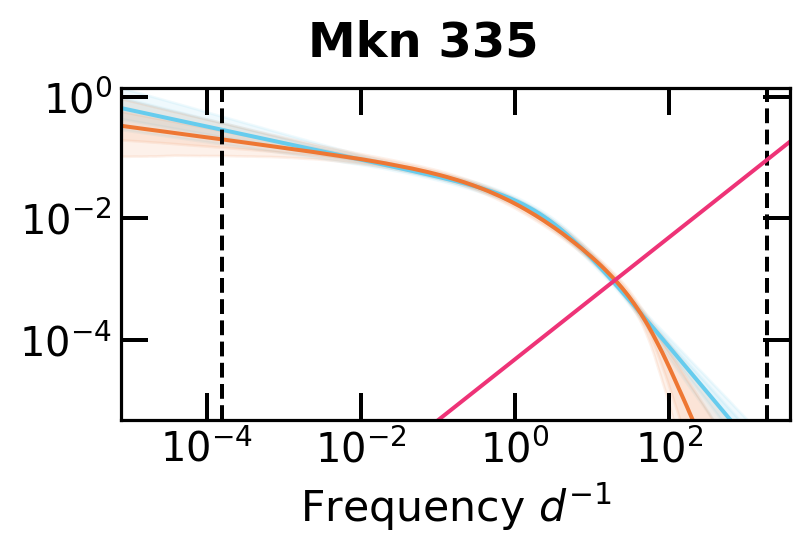
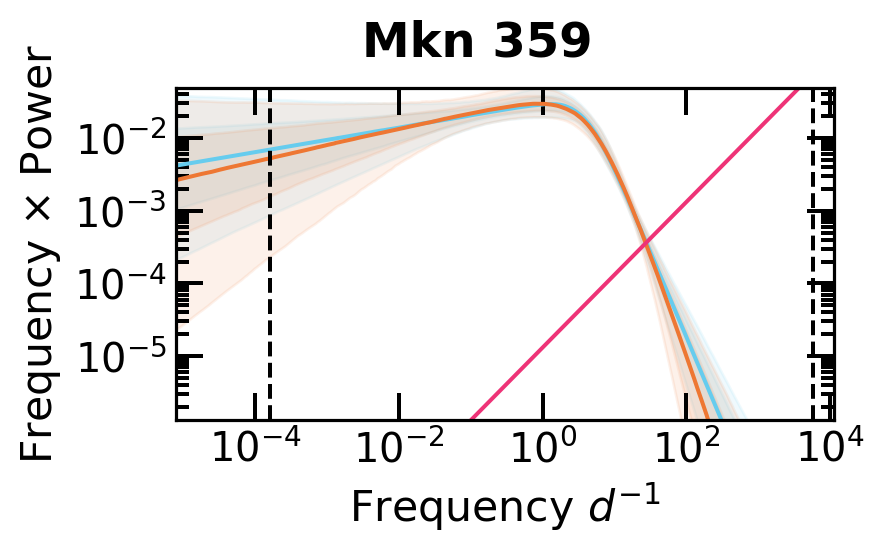
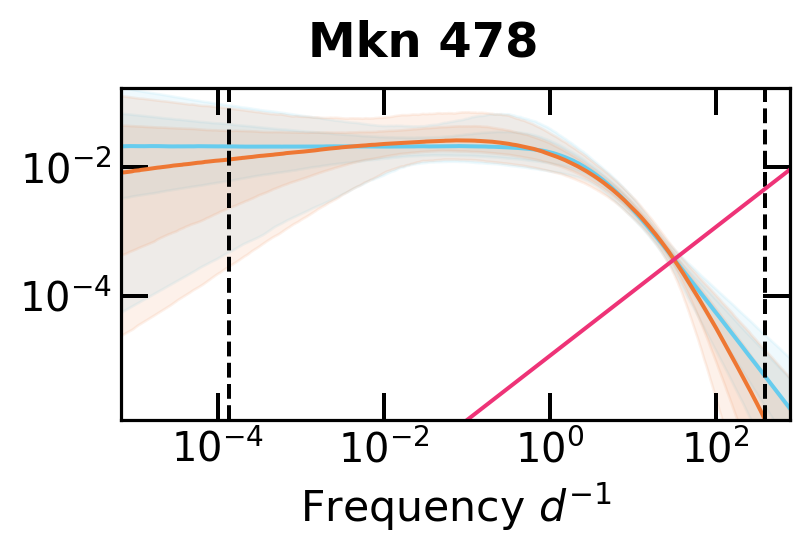
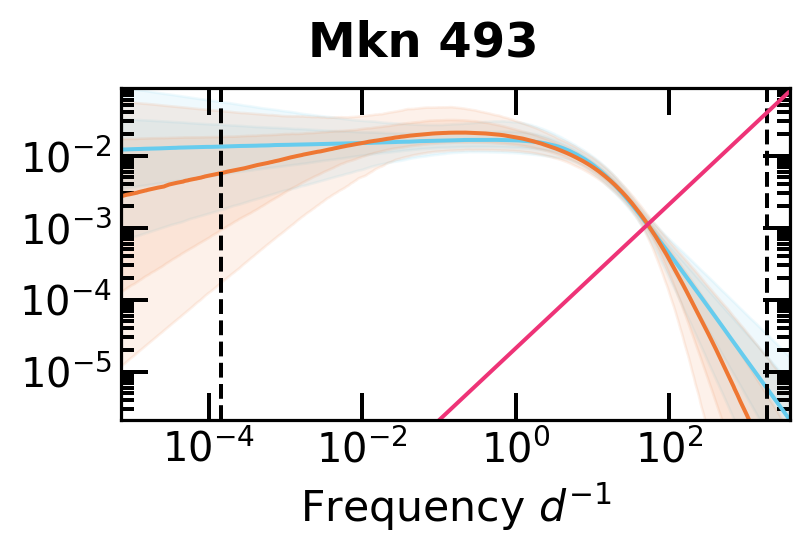
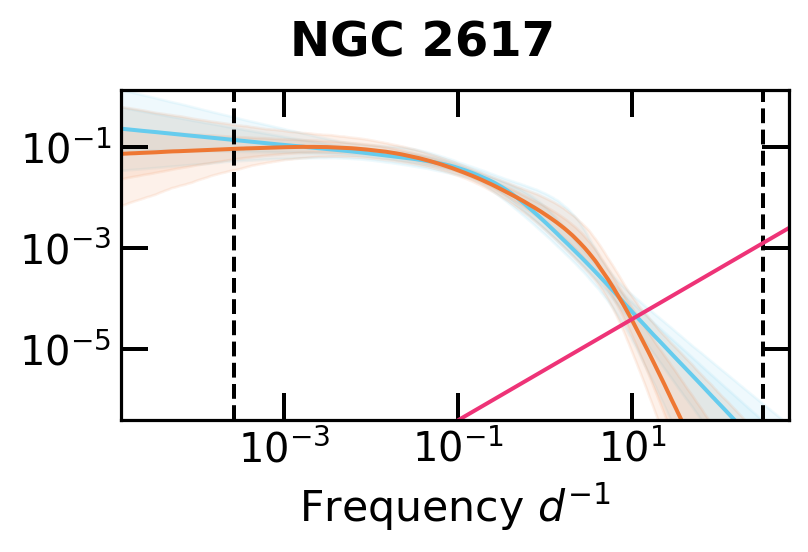
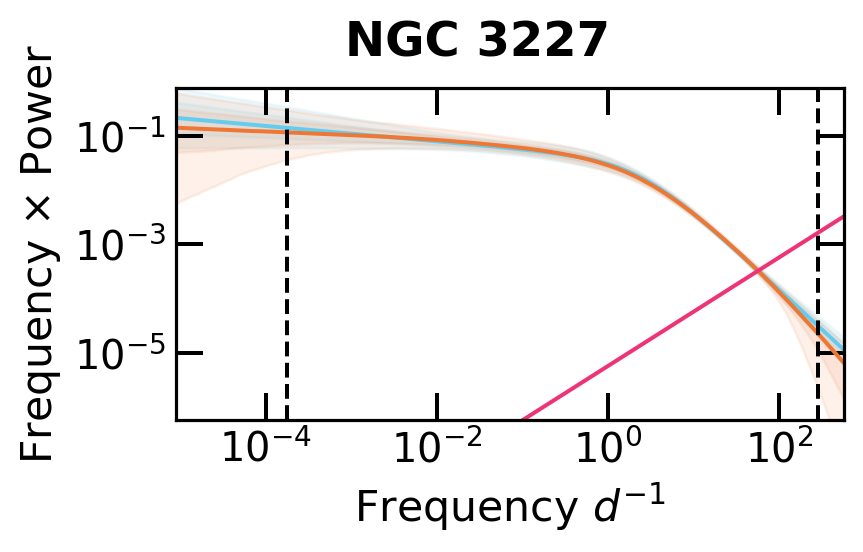
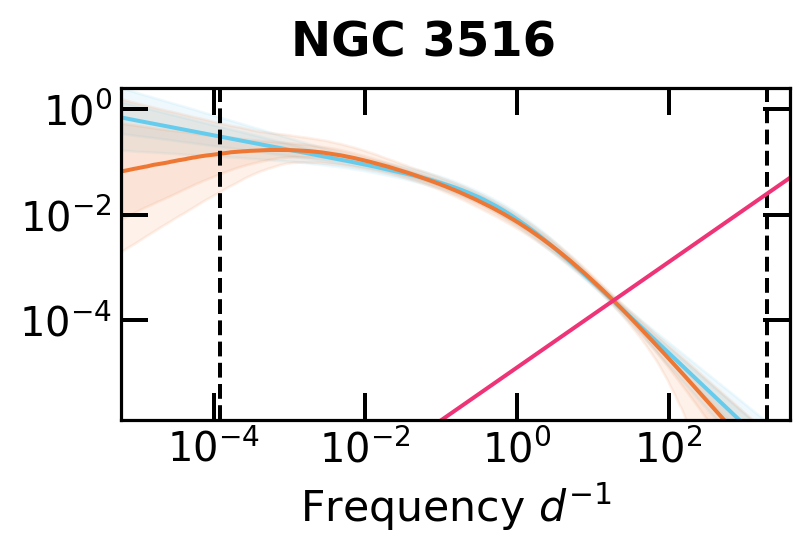
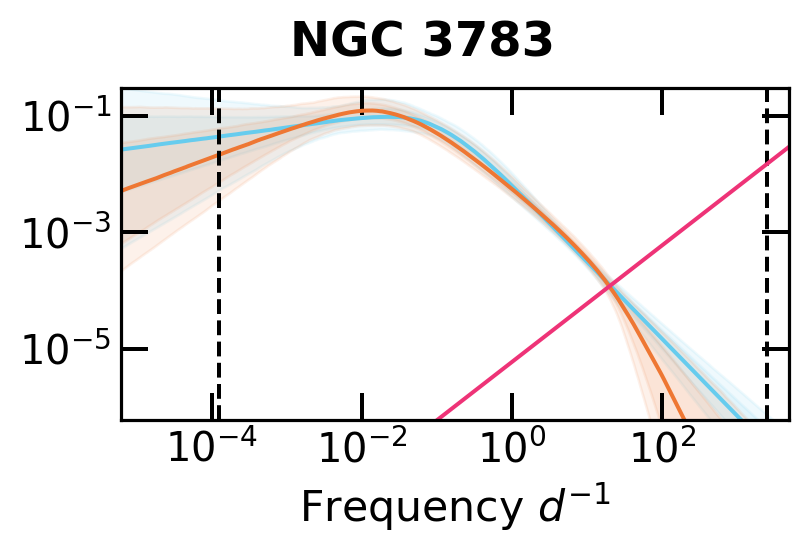
## Comparison with the single bend model
```{python}
#| layout-ncol: 4
for i,dir in enumerate(double_dirs[:]):
    source = dir_list[i]
    if os.path.exists(dir):

        path_double_plots = f"{path}/{source}_combined_{band}_double_123_factor/plots/"
        path_single_plots = f"{path}/{source}_combined_{band}_single_123_factor/plots/"

        A = np.genfromtxt(f"{path_single_plots}/psd_ppc_data.txt").T
        f,psd_quantiles,psd_approx_quantiles = A[:, 0], A[:, 1:6], A[:, 6:]

        t,y,yerr = np.genfromtxt(f"{path}/{source}_combined_{band}_{short_model}_123_factor/{source}_combined_{band}_{short_model}_subset_time_series.txt", unpack=True)
        f_min,f_max = 1/(t[-1]-t[0]), 1/(2*np.min(np.diff(t)))

        A = np.genfromtxt(f"{path_double_plots}/psd_ppc_data.txt").T
        f_P = find_spectral_str(f"{path_double_plots}/psd_ppc_data.txt")
        psd_noise_levels = [2*np.median((yerr/y)**2)*np.median(np.diff(t))]
        f_d,psd_quantiles_d,psd_approx_quantiles_d = A[:, 0], A[:, 1:6], A[:, 6:]

        fig3,ax3 = replot_psd_overplot(f,psd_quantiles,f_d,psd_quantiles_d,psd_noise_levels,f_min,f_max,f_P=f_P)
        fig3.suptitle(f"{dirname2prettyname(source)}")
        fig3.tight_layout()
        ax3.get_legend().remove()
        fig3.set_size_inches(4., 3)
        if i %4 !=0:
            ax3.set_ylabel("")
```